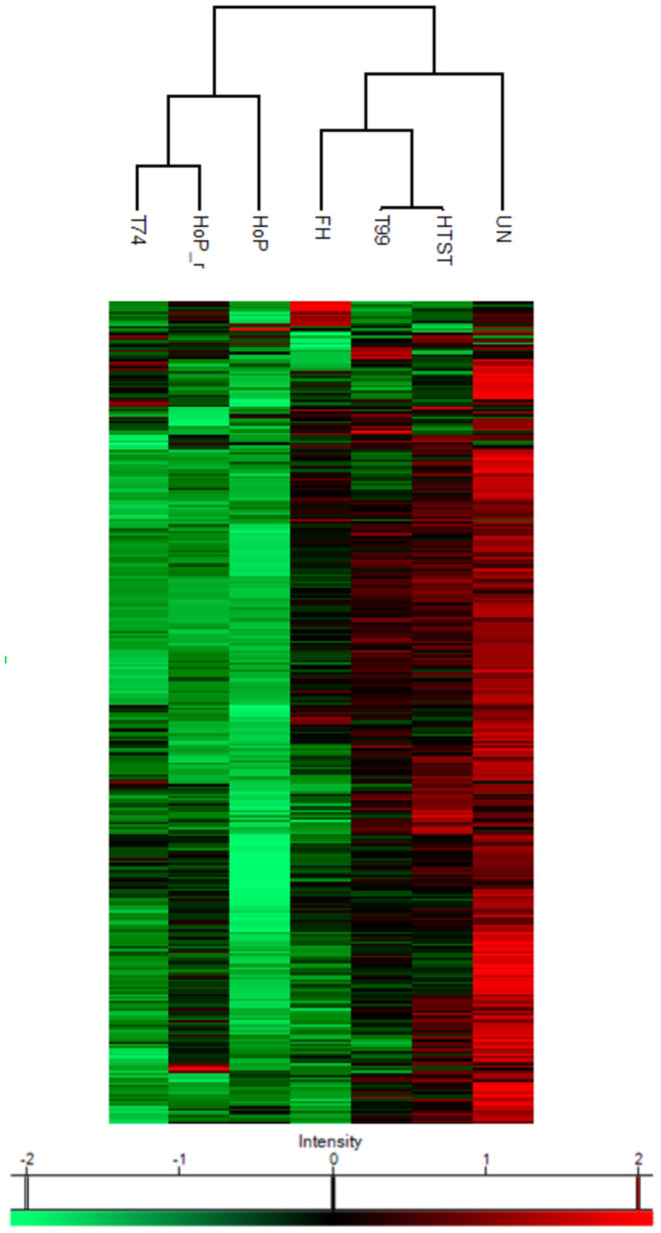
Figure 4.

Heat map indicating differences in protein profile of the differentially heated DHM samples. The color scale is based on z-score normalized iBAQ values and each row represents individual proteins. Hierarchical clustering was performed using a Euclidean distance metric. The analyses were performed in duplicate for each sample and all values are presented as mean ± standard deviation of two independent experiments UN, HTST, FH, T99, T74, HoP and HoP_r stand for untreated DHM, and DHM treated with high-temperature short-time, flash heating, high-temperature short-time with a thermomixer preheated at 99°C, high-temperature short-time with a thermomixer preheated at 74°C, holder pasteurization and holder pasteurization with rapid heating up-times, respectively.
