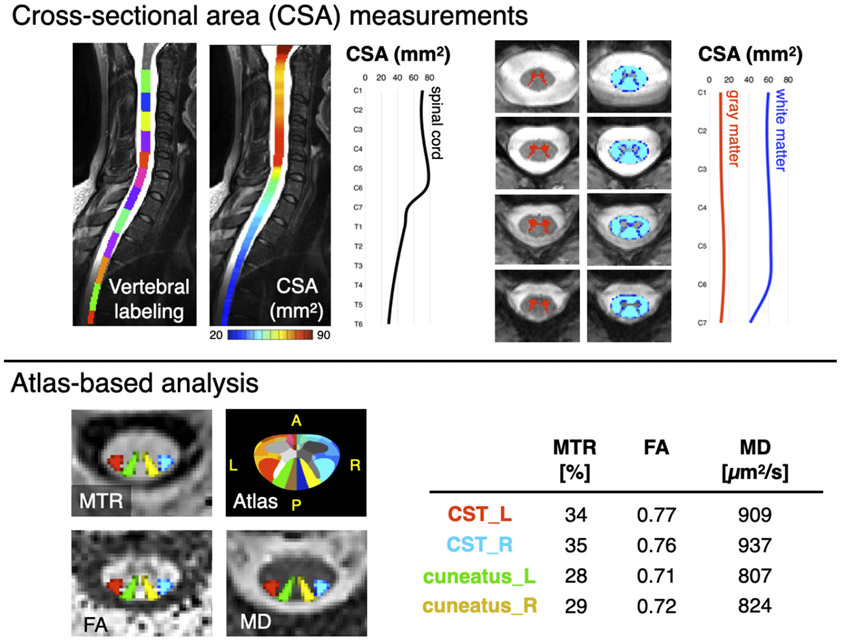
Figure 1. Illustration of the MRI metrics that could be extracted from the spine generic protocol.
The top panel “Cross-sectional area (CSA) measurements” shows morphometric measures of the spinal cord and its gray and white matter. The bottom panel “Atlas-based analysis” on the left shows axial views of qMRI maps: Magnetization Transfer Ratio (MTR), Fractional Anisotropy (FA) and Mean Diffusivity (MD), with an overlay of 4 spinal tracts of general interest: the descending corticospinal tract (CST) and the ascending cuneatus, left (L) and right (R). The “Atlas” image corresponds to the white matter atlas 32, which includes 30 white matter tracts that could be used for computing metrics within specific tracts of interest. This atlas also includes 6 parcellations of the gray matter. The table shows average values of each metric in the corresponding tract.

