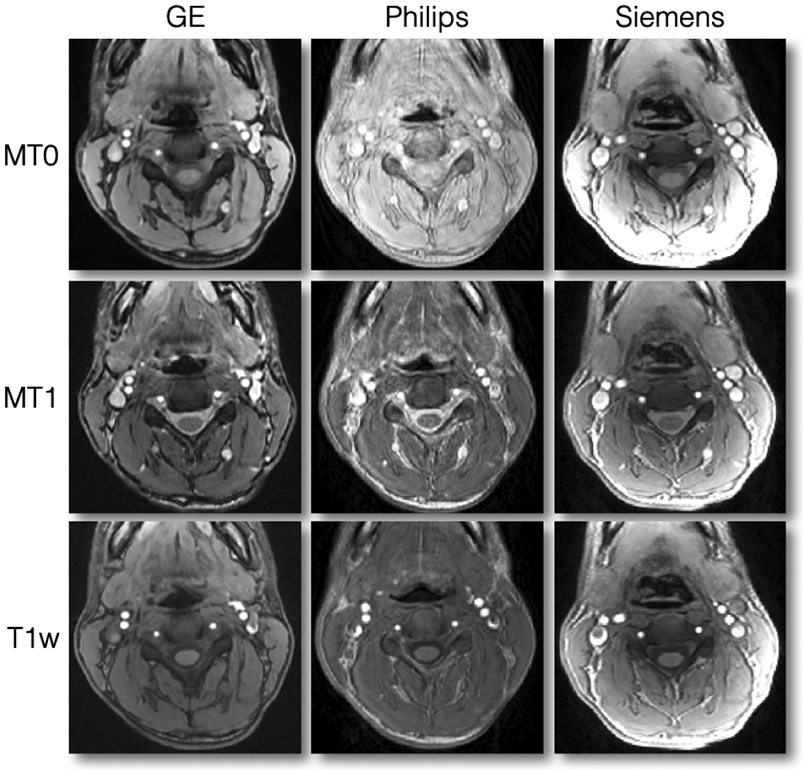
Figure 12.

Axial views of good quality data for MT0, MT1 and T1w scans. Notice the slight motion artifact on the Philips MT0 scan. Also notice the strong signal intensity at the periphery of the tissue on the Siemens scans, which is due to the inactivation of the intensity bias filter. This filter is not relevant when computing qMRI metrics such as MTR or MTsat.
