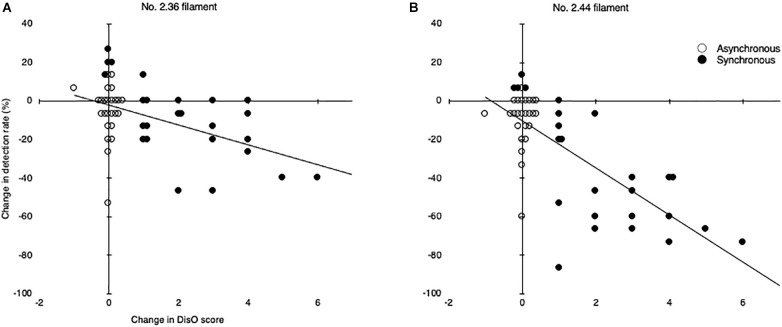
FIGURE 6.
Scatterplots of disownership-score changes and detection-rate changes. (A) The relationship between disownership-score (DisO) changes and detection-rate changes for the No. 2.36 filament in all conditions. (B) The relationship between disownership-score (DisO) changes and detection-rate changes for the No. 2.44 filament in all conditions. Data from 25 subjects are plotted. Closed circles indicate plots under the synchronous condition. Open circles indicate plots under the asynchronous condition. Trend-lines show significant negative correlations for both No. 2.36 filaments (ρ = −0.478, p < 0.0005) and No. 2.44 filaments (ρ = −0.713, p < 0.0005).

