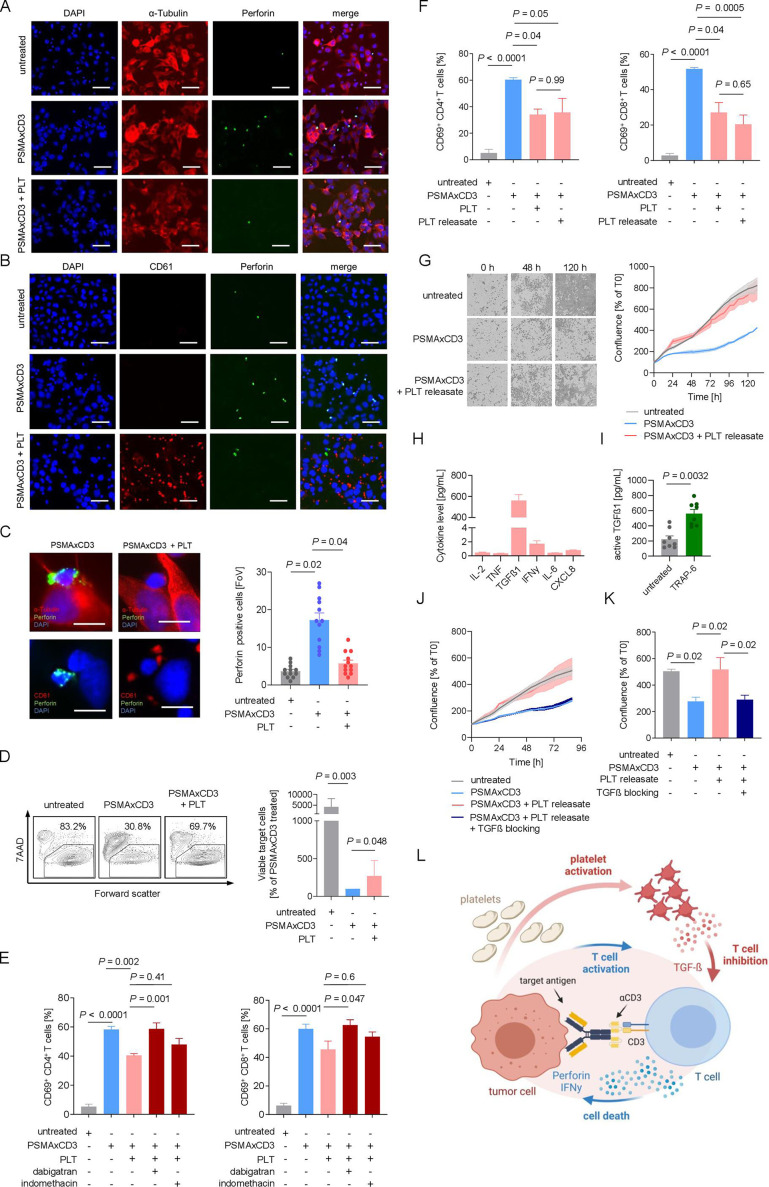
Figure 3.
Platelets undermine treatment efficacy of bsAb via the TGF-β axis. (A–C) Immunofluorescent staining after 2.5 hours of coincubation of LNCaP cells and PBMCs (E:T ratio of 4:1) in the presence of PSMA×CD3 (200 ng/mL) and platelets (E:P ratio of 10:1). Statistical significance was calculated by one-way ANOVA and Tukey’s multiple comparisons test. (A) Cells were stained for tubulin (red) and perforin (green). Nuclei were stained using DAPI (blue). Scale bar indicates 100 µm, original magnification ×20. (B) Platelets were stained for CD61 (red); nuclei were stained using DAPI (blue) and perforin (green). Scale bar indicates 100 µm, original magnification ×20. (C) Exemplary immunofluorescence staining of tumor–platelet immune cell interactions (left). Scale bar indicates 20 µm, original magnification ×63. Quantification of perforin-positive cells per FoV (n=12) (right). (D) PBMCs of healthy donors (n=7) were incubated with LNCaP cells (E:T ratio of 2.5:1.0) with and without PSMA×CD3 in the presence or absence of platelets (E:P 100:1) as indicated for 72 hours. Then target cell lysis was analyzed by flow cytometry to determine the percentage of 7-aminoactinomycin (7AAD)-positive LNCap cells. Left panel: exemplary plots obtained with a single donor; right panel: combined data obtained with seven independent donors displayed as percentage of viable target cells after bsAb treatment. Statistical significance was calculated by Kruskal-Wallis and Dunn’s multiple comparisons test. (E) Activation of CD4+ and CD8+ T cells was determined by expression of CD69 after 24 hours of treatment with PSMA×CD3 and platelets (E:T ratio of 4:1, E:P ratio of 100:1). Platelets were preincubated with dabigatran (0.5 mM) or indomethacin (0.05 mM) for 30 min before adding to the assay. Statistical significance was calculated by one-way ANOVA and Tukey’s multiple comparisons test. (F) Activation of CD4+ and CD8+ T cells was analyzed after incubation with LNCaP cells (E:T ratio of 4:1) and treatment with anti-PSMA×CD3, platelets (E:P ratio of 100:1) or PR (n=4). Statistical significance was calculated by one-way ANOVA and Tukey’s multiple comparisons test. (G) PSMA×CD3-induced cell death of LNCaP cells was determined using live cell imaging. Cells were incubated with PBMCs and platelets. In the left panel, representative pictures at 0, 48, and 120 hours are displayed. In the right panel, pooled data are shown (n=8). (H) PR has been generated as described in the Methods section, and the indicated cytokines were measured using LEGENDplex assay (n=8). (I) The concentration of active TGF-β in the platelet supernatant before and after stimulation with TRAP-6 is shown (n=8). Statistical significance was calculated using Student’s t-test. (J, K) Cytotoxicity of PBMC against LNCaP cells after treatment with PSAM×CD3, and platelet release with or without blocking of the TGF-β axis using the combination of SB431542 (20 µM) and anti-TGF-β antibody (2 µg/mL) is shown (n=8). (K) Pooled data of cell confluence measured after 88 hours of treatment. Statistical significance was calculated by one-way ANOVA and Holm-Sidak’s multiple comparisons test. (L) Schematic illustration of the proposed model of an inhibitory loop driven by platelets and platelet-released TGF-β, undermining the efficacy of T cell-recruiting bsAbs. The graphic was created by BioRender (BioRender.com, Toronto, Canada). ANOVA, analysis of variance; bsAb, bispecific antibody; DAPI, 4′,6-diamidino-2-phenylindole; E:P, effector to platelet; E:T, effector to target; FoV, field of view; PBMC, peripheral blood mononuclear cell; PR, platelet releasate; TGF-β, transforming growth factor beta.

