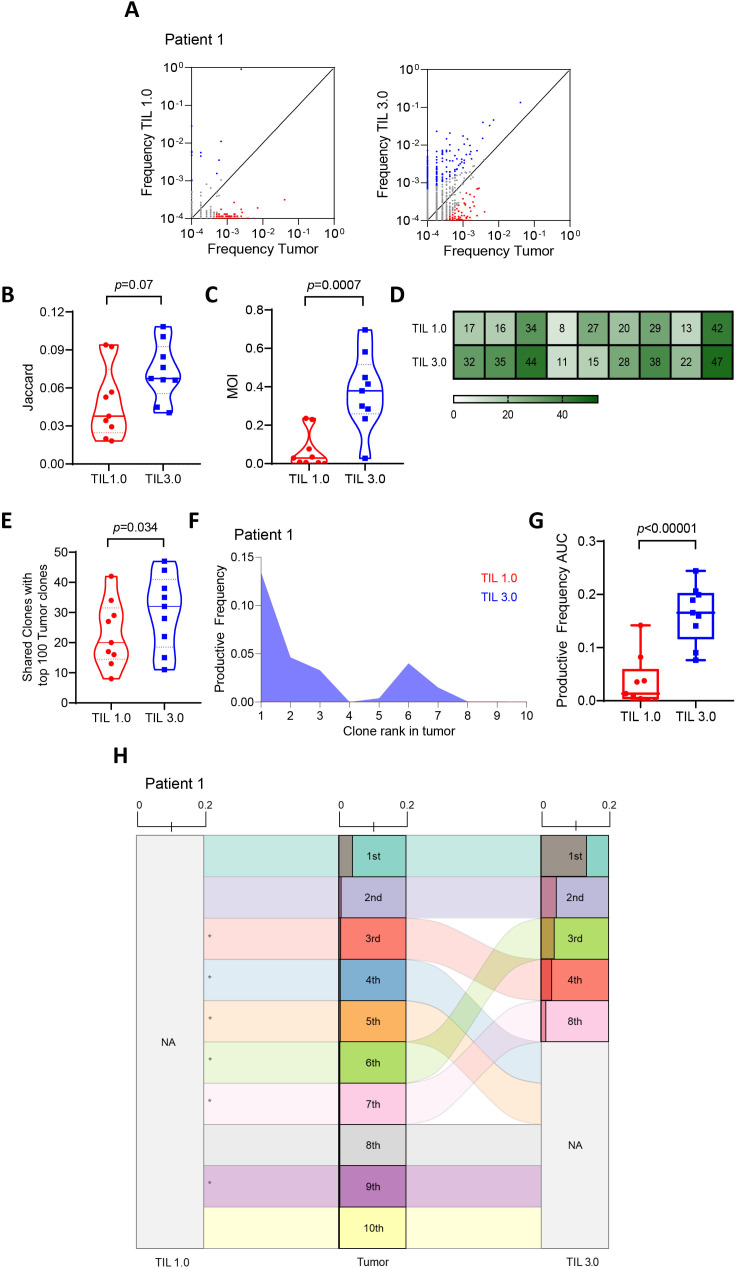
Figure 2.
Both tumor-infiltrating lymphocytes (TIL) propagation methods result in distinct T-cell receptor (TCR) repertoires with TIL 3.0 maintaining a higher resemblance to tumor. (A) Representative differential abundance plot comparing expanded T-cell repertoire in TIL 1.0 vs tumor (left panel) and TIL 3.0 vs tumor (right panel). Each circle represents a unique TIL TCR clone. Circles on either axis represents clones that are exclusively present in tumor (y-axis) or expanded in grown TIL product (x-axis). Clones with reads ≥1 were included. The black solid line is the frequency equality line and circles adjoining the equality line represents TCR clones that are equally expanded both in the tumor and the grown TIL product. Blue circles represent TIL TCR clones preferentially expanded in the grown TIL and the red circles represent TCR clones preferentially present in the tumor. Comparison of (B) Jaccard index (paired, n=9) and (C) Morisita Overlap Index (MOI) (paired, n=9) between TIL 1.0 and TIL 3.0 expanded product to tumor. (D) Heatmap of proportion of top 100 TIL clones present in the tumor in TIL 1.0 and TIL 3.0 clones stratified per patient; each vertical row represents a patient (n=9). (E) Comparison of the proportion of top 100 TIL clones found in the tumor present in the top 100 TIL 1.0 and TIL 3.0 clones (paired, n=9). (F) Representative plot of comparison of the productive frequency of top 10 resected tumor T-cell clones in grown TIL 1.0 and TIL 3.0 product. (G) Comparison of the productive frequency of top 10 TIL clones found in the tumor and the productive clonality of the same TIL clones in the top 10 TIL 1.0 and TIL 3.0 expansion products (paired, n=9). (H) Representative alluvial plot depicting the top 10 ranked TIL clones found in the tumor to their corresponding rank in TIL 1.0 and TIL 3.0 culture method. NA means not present in top 10 and * means they are not present in expanded TIL product. Shaded region in each clone represents the productive frequency (range from 0.0 to 0.2). Statistical analysis was performed by paired t-test on (B), (C), (E) and (F).

