Figure 3.
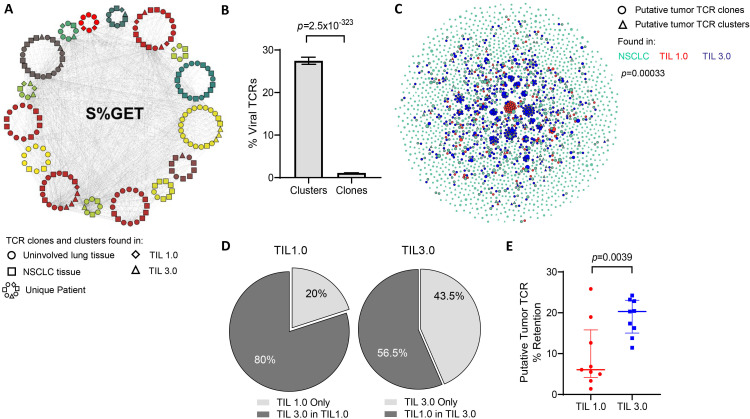
Putative tumor-specific T-cell receptors (TCR) are better retained in tumor-infiltrating lymphocytes (TIL) expanded with TIL 3.0. (A) An example of a single TCR cluster which shares the central S%GET motif and potentially recognize the same antigen, as annotated by Grouping of Lymphocyte Interactions by Paratope Hotspots V.2 (GLIPH2). Each circular pattern represents a single patient. Circles indicate TCR motifs found in uninvolved lung tissue, squares represent non-small cell lung cancer (NSCLC) tissue, diamonds for TIL 1.0 expanded TCR and triangles indicate TIL 3.0 expanded TCR. Gray lines connect similar TCR motifs across patients, tissue compartments and expanded TIL products. (B) Graph representing percentage of predicted viral-specific TCR found in TCR clusters and clones defined in (A) across all patients’ samples. (C) Representative graph of putative tumor-specific TCR clones (circles) and clusters (triangles) found in the baseline NSCLC tissue (green), TIL expanded with TIL 1.0 (red) and TIL 3.0 (blue) from a single patient. The connecting gray lines represent the shared TCR motifs from the tumor tissue and their homologous TCR in the expanded TIL product. (D) Pie charts depicting the proportion of putative tumor-associated antigens (TAA)-specific expanded TIL found exclusively (light gray) in TIL 1.0 expanded product (left) and in TIL 3.0 (right). The dark gray represents the proportion of putative TAA-specific expanded TIL from each respective method that are found in the product of the other expansion method. (E) Graph displaying the comparison of the retained putative tumor-specific TCR in TIL 1.0 and TIL 3.0 expansion product across all patients (paired, n=9). Statistical analysis was performed by Fisher’s exact test on (B), sign-rank test on (D) and paired t-test on (E).

