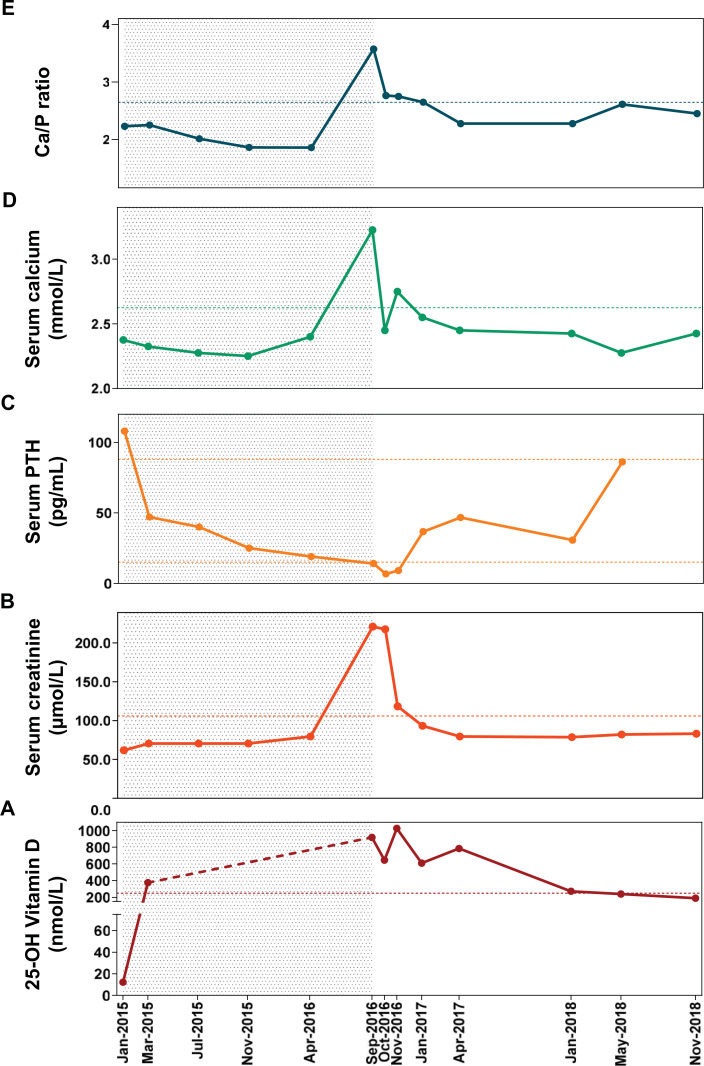
Fig. (1).
Temporal evolution of serum vitamin D (A), creatinine (B), PTH (C), serum calcium (D), and Calcium to Phosphorus ratio (E) during the ultra-high dose supplementation of cholecalciferol (grey area) ended at the moment of clinical intoxication, and during the subsequent follow-up. Grey area from January 2015 to September 2016 defines the period of supplementation with high doses of vitamin D. In box A: levels of vitamin D from March 2015 to September 2016 are above 375 nmol/L, but not assessed through dilution, and they are represented by the red dashed line. In boxes B, D and E: horizontal dashed lines represent the upper limit of normal ranges of creatinine, calcium, and Ca/P ratio. In box C: horizontal dashed lines represent the upper and the lower limits of normal range of PTH. Abbreviations: Ca, calcium; P, phosphorus; PTH, parathyroid hormone. (A higher resolution / colour version of this figure is available in the electronic copy of the article).

