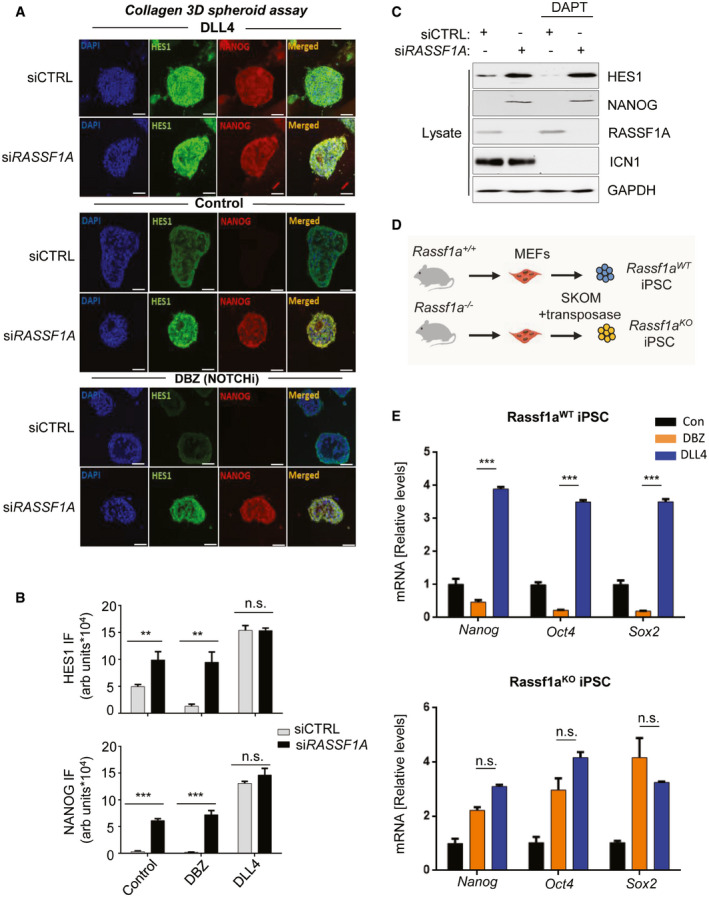
Figure 3. Loss of RASSF1A stabilizes HES1 independently of the NOTCH‐HES1 axis and confers resistance to GSIs.

- Top panel: HeLa cells were transfected with either siCTRL or siRASSF1A and subjected to collagen 3D spheroid assay, in the additional presence of the Notch ligand DLL4 (1 μg/ml), increasing HES1 and NANOG expression as assessed by immunofluorescence. Middle panel: Same as top panel, without the presence of DLL4. Bottom panel: Same as top panel, in the additional presence of the GSI DBZ (100 nM) showing upregulation of both NANOG and HES1 upon RASSF1A depletion despite NOTCH‐HES1 inhibition. See also Fig EV4D.
- Quantification of HES1 and NANOG signal intensities displayed in A.
- HeLa cells transfected with either siCTRL or siRASSF1A were subjected or not to treatment with the GSI DAPT (50 μM) and their lysates were immunoblotted against indicated antibodies. Cleaved Notch (ICN1) levels were used as readout of DAPT treatment.
- Schematic depicting iPSC derivation from Rassf1aWT and Rassf1a −/− fibroblasts isolated from the respective mouse strains.
- Top: qPCR for core SC marker mRNA expression in Rassf1aWT iPSC upon DBZ or DLL4 treatment for 24 h. See also Fig EV5E. Bottom: qPCR for core SC marker mRNA expression in Rassf1aKO iPSC upon DBZ or DLL4 treatment for 24 h. RASSF1A loss desensitizes cells to the downstream effects of DBZ treatment.
Data information: Scale bars: 50 μm. **P < 0.01 and ***P < 0.001, respectively, of Student’s t‐test; n.s. stands for non‐significant. Error bars indicate s.e.m. Data shown are representative of three biological replicates (n = 3).
Source data are available online for this figure.
