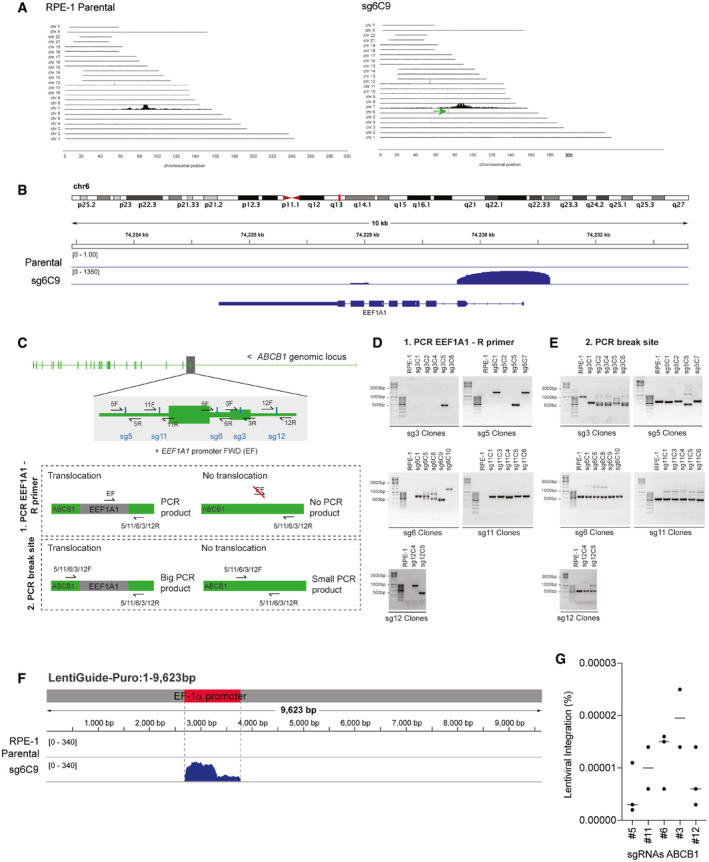
Figure 2. sgRNA integration and transcription activation of ABCB1 .

- TLA analysis for ABCB1 contacts in RPE‐1 parental and Taxol‐resistant clone sg6C9 covering the whole genome. Green arrow in sg6C9 shows a de novo interaction found between ABCB1 and a region in chromosome 6.
- TLA analysis for RPE‐1 parental and sg6C9. Zoom in in the region of chr6 with de novo interaction for sg6C9. Image modified from IGV viewer.
- Graphical representation of the PCR products to assess vector integration. Two different primer pairs were used to PCR the vector integration: (i) a common EEF1A1 Forward (F) primer with a specific Reverse for each break site (5/11/6/3/12R). Only when EEF1A1 is integrated in cis, we will obtain a PCR product. (ii) Forward and reverse primers are used to amplify each specific break site (5/11/6/3/12F and R). If EEF1A1 is integrated in the break site, the PCR product will be bigger.
- PCR products using the primers in C(1) over the ABCB1 and EEF1A1 regions in RPE‐1 parental and the different Taxol‐resistant clones.
- PCR products using the primers in C(2) over the specific break site in the ABCB1 promoter in RPE‐1 parental and the different Taxol‐resistant clones.
- TLA analysis for RPE‐1 parental and sg6C9. Reads are aligned to the lenti‐guide vector. The location of the EF1α promoter from the vector is highlighted in red. Image modified from IGV viewer.
- Percentage of RPE‐1 cells targeted with the ABCB1 promoter sgRNAs found with vector integration. Percentages were calculated from data in Fig 1A. Each dot represents a CFA replicate experiment. Horizontal bars represent the mean of lentiviral integration per sgRNA.
