
Figure 1. ACE2 expression increases during aging in mouse and human lungs.
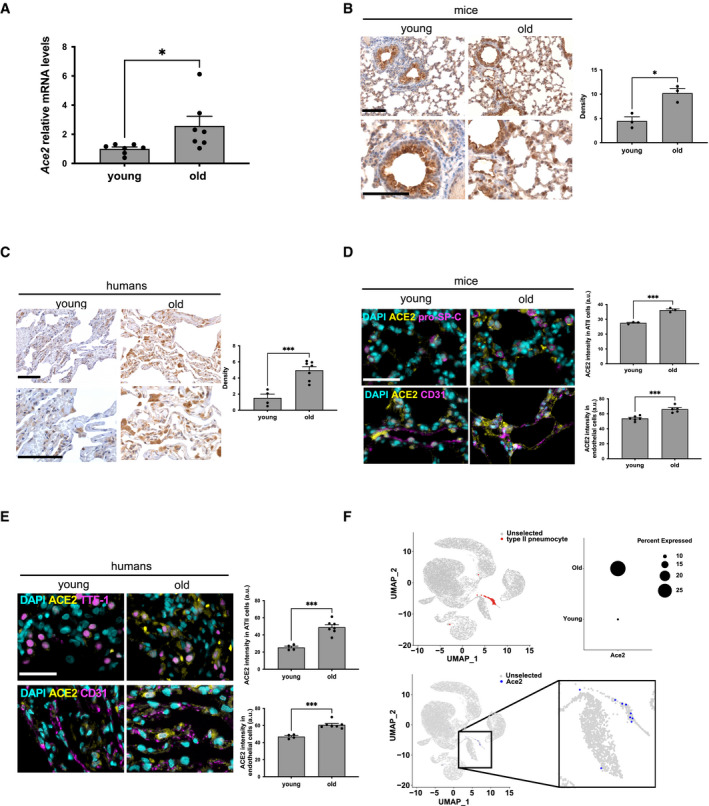
- RT‐qPCR detection of Ace2 mRNA expression levels in lungs from young (2–3 months) and old (22–24 months) mice (n = 7 mice per group).
- Representative microphotographs and quantitative analyses of ACE2 immunohistochemical staining in lungs from young (2 months) and old (22 months) mice (n = 3 mice per group). Scale bar, 200 µm.
- Representative microphotographs and quantitative analyses of ACE2 immunohistochemical staining in lung parenchyma of young (20–35 years old) and old (60–80 years old) humans (n = 4–7 individuals per group). Scale bar, 200 µm.
- Double‐marker immunofluorescence and quantitative analyses of ACE2 intensity level in pro‐SP‐C‐positive type II pneumocytic and CD31‐positive endothelia in lungs from young and old mice (n = 3–6 mice per group). Scale bar, 100 µm. a.u. = arbitrary units.
- Double‐marker immunofluorescence and quantitative analyses of ACE2 intensity level in TTF‐1‐positive type II pneumocytic and CD31‐positive endothelia in lungs from young and old humans (n = 4–7 individuals per group). Scale bar, 100 µm. a.u. = arbitrary units.
- Single‐cell transcriptomic data from aging tissues in the mouse lung from Tabula Muris Senis. Upper left panel: uniform manifold approximation and projection (UMAP) of cell identity with ATII cells represented as red dots. Upper right panel: dot plot of Ace2 expression according to age (young = 3 months; old = 30 months). Dot size represents fraction of cells expressing a given gene. Lower panel: UMAP of Ace2 expressing cells depicted as blue dots.
Data information: In (A–E), data are presented as mean ± SEM. *P < 0.05, ***P < 0.001 two‐sided unpaired Student's t‐test.