
Figure 2. ACE2 levels increase upon telomere shortening in human cells and in lungs of G3 Terc−/− mice.
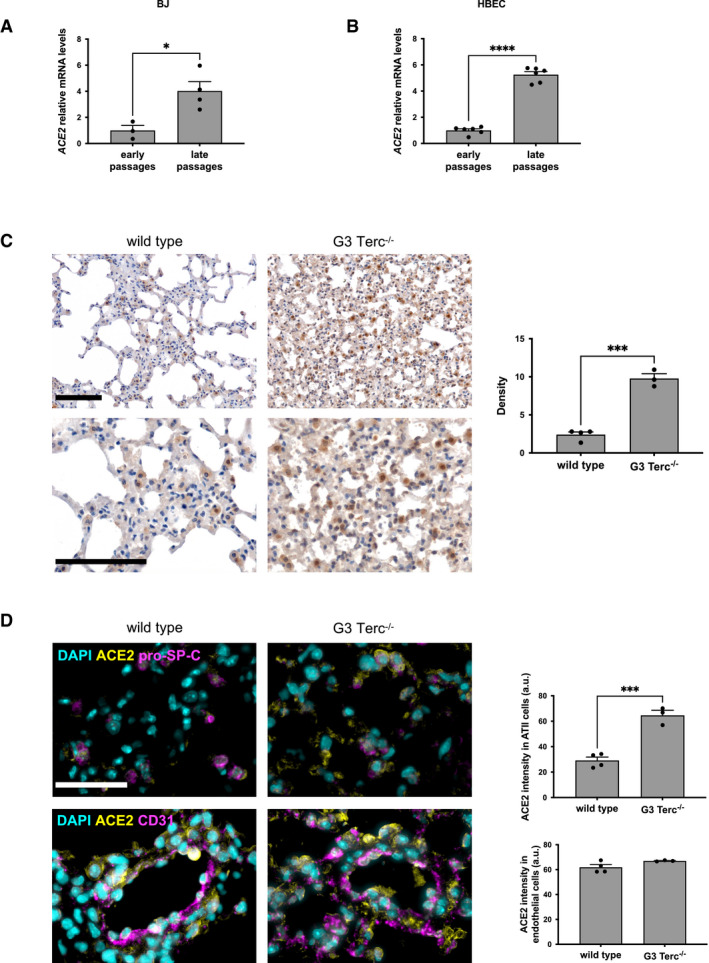
- RT‐qPCR detection of ACE2 mRNA expression levels in early passages (PD 34–37) and late passages (PD 61‐64) human normal fibroblasts (BJ) (n = 3–4 replicates per group).
- ddPCR detection of ACE2 mRNA expression levels in early passages (PD 22.37) and late passages (PD 140) human bronchial epithelial cells (HBEC) (n = 6 replicates per group).
- Representative images and quantitative analyses of ACE2 immunohistochemical staining in lungs of age‐matched wild‐type and G3 Terc−/− mice (n = 3–4 mice per group). Scale bar, 200 µm.
- Double‐marker immunofluorescence and quantitative analyses of ACE2 intensity level in pro‐SP‐C‐positive type II pneumocytic and CD31‐positive endothelia in lungs of age‐matched wild‐type and G3 Terc−/− mice (n = 3–4 mice per group). Scale bar, 100 µm. a.u. = arbitrary units.
Data information: In (A–D), data are presented as mean ± SEM. *P < 0.05, ***P < 0.001, ****P < 0.0001. Two‐sided unpaired Student's t‐test.