
Figure 5. Selective inhibition of telomeric DDR decreases ACE2 expression in cultured cells and in vivo .
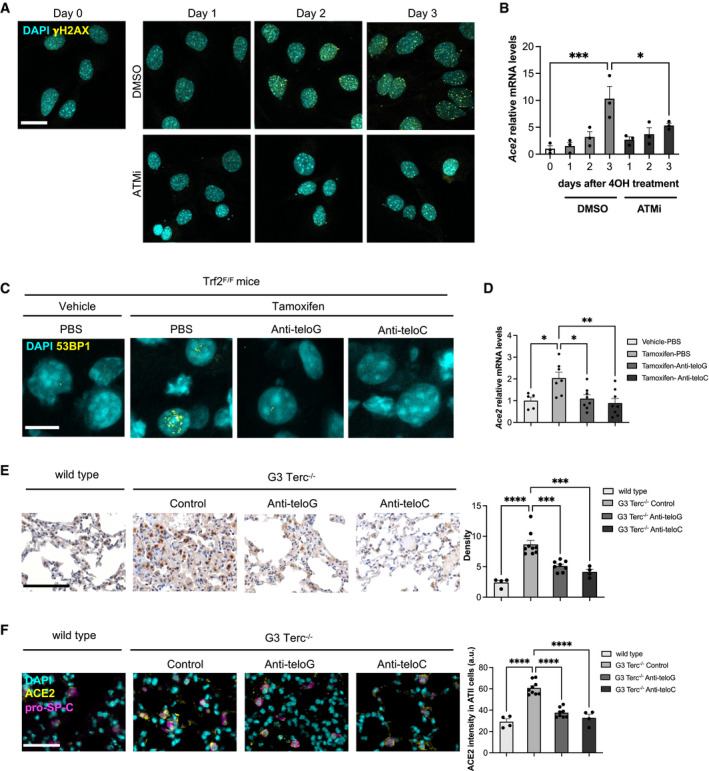
- Immunofluorescence showing γH2AX foci in Trf2F/F MEFs at the indicated time points following 4OHT treatment and consequent TRF2 knockout and treated with DMSO or ATMi. Scale bar, 25 µm.
- RT‐qPCR detection of Ace2 mRNA expression levels in MEFs Trf2F/F treated as in A (n = 3 independent experiments).
- Representative immunofluorescence images of 53BP1 staining in liver from Trf2F/F mice treated with tamoxifen (to induce telomere uncapping) or vehicle and injected with the indicated ASOs or PBS as control. Scale bar, 10 µm.
- RT‐qPCR detection of Ace2 mRNA levels in livers of mice treated as in C (n = 5–8 mice per group).
- Representative microphotographs and quantitative analyses of ACE2 immunohistochemical staining in lungs of age‐matched wild‐type and G3 Terc−/− mice, treated with the indicated ASOs (n = 4–9 mice per group). Scale bar, 200 µm.
- Double‐marker immunofluorescence and quantitative analyses of ACE2 intensity level in pro‐SP‐C‐positive type II pneumocytic cells in lungs of age‐matched wild‐type and G3 Terc−/− mice, treated with the indicated ASOs (n = 4–9 mice per group). Scale bar, 100 µm. a.u. = arbitrary units.
Data information: In (B, D–F), data are presented as mean ± SEM. *P < 0.05, **P < 0.01, ***P < 0.001, ***P < 0.0001. Two‐way paired (B) or unpaired (D‐F) ANOVA.