
. 2022 Jan 19;24(1):e28647. doi: 10.2196/28647
©Monika Dominiak, Katarzyna Kaczmarek-Majer, Anna Z Antosik-Wójcińska, Karol R Opara, Anna Olwert, Weronika Radziszewska, Olgierd Hryniewicz, Łukasz Święcicki, Marcin Wojnar, Paweł Mierzejewski. Originally published in the Journal of Medical Internet Research (https://www.jmir.org), 19.01.2022.
This is an open-access article distributed under the terms of the Creative Commons Attribution License (https://creativecommons.org/licenses/by/4.0/), which permits unrestricted use, distribution, and reproduction in any medium, provided the original work, first published in the Journal of Medical Internet Research, is properly cited. The complete bibliographic information, a link to the original publication on https://www.jmir.org/, as well as this copyright and license information must be included.
Figure 1.
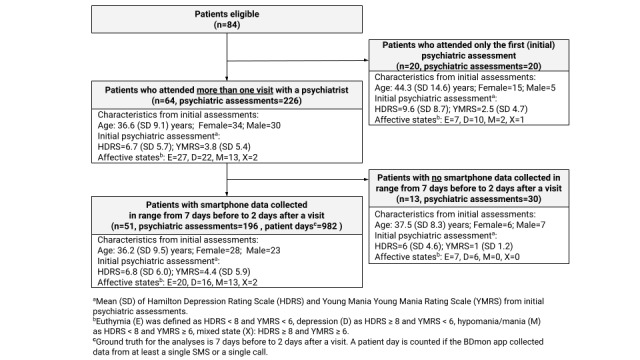
Flow chart illustrating the number of patients, psychiatric assessments, and patient days during the study.