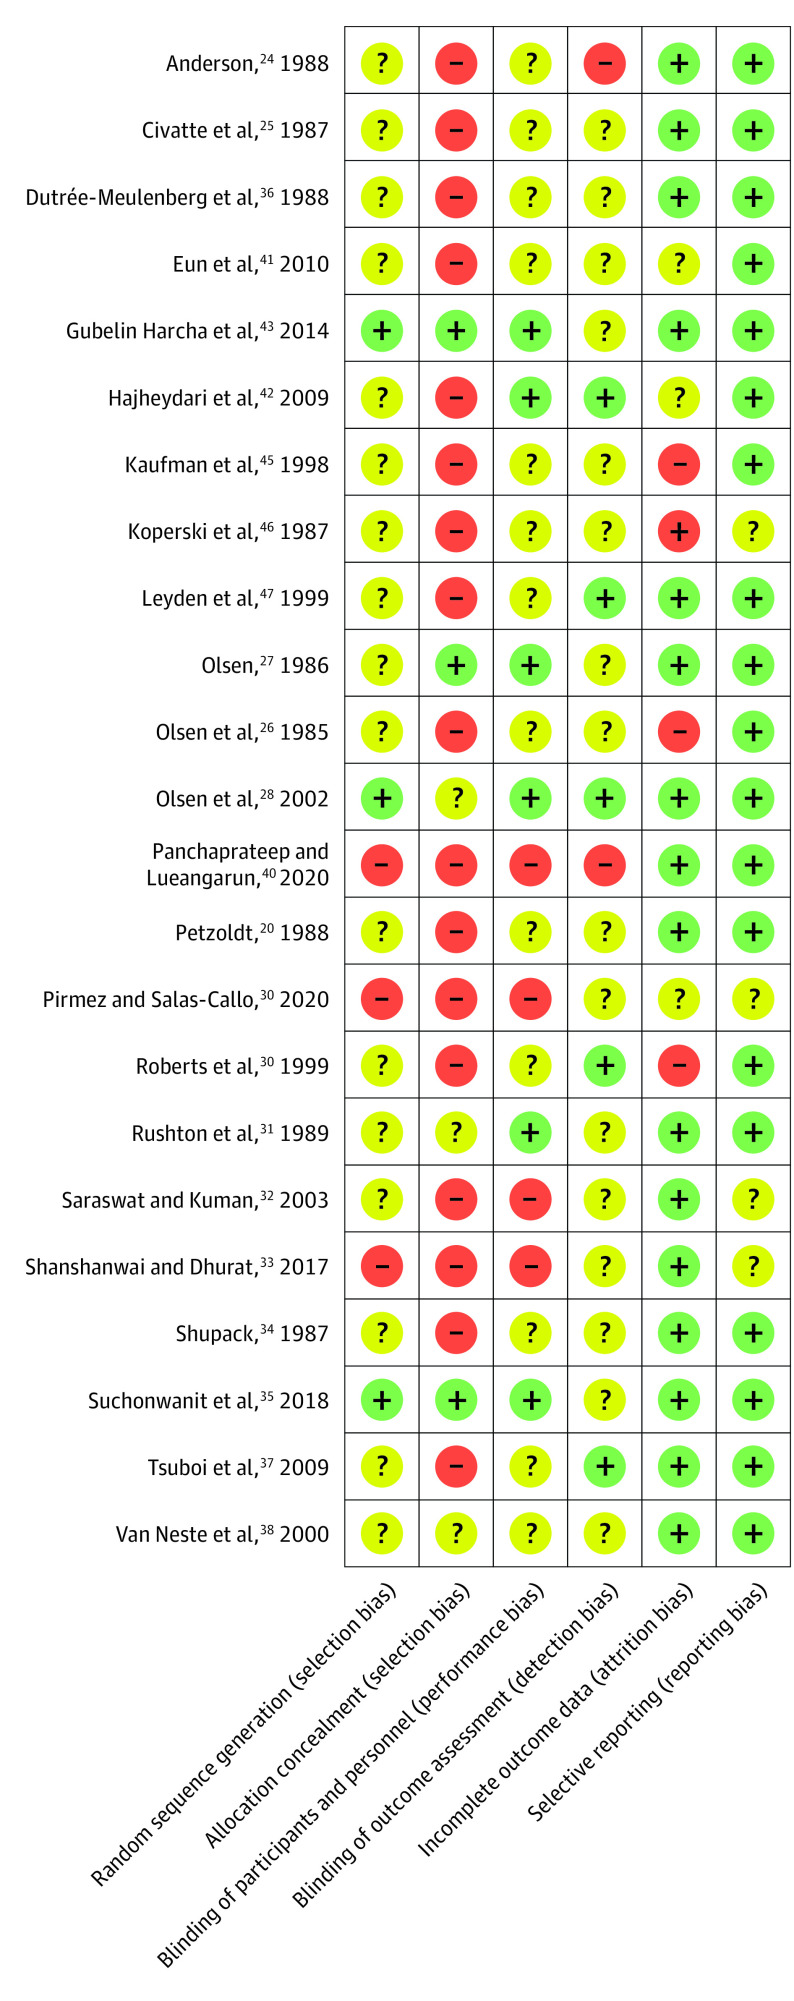
Figure 2. Risk of Bias Summary.
Risk of bias across 6 domains for the 23 studies that were eligible for quantitative analyses is shown. Each domain received 1 of 3 judgments, namely, low risk of bias (denoted by green or the plus sign), unclear risk of bias (denoted by yellow or the question mark), and high risk of bias (denoted by red or the minus sign).

