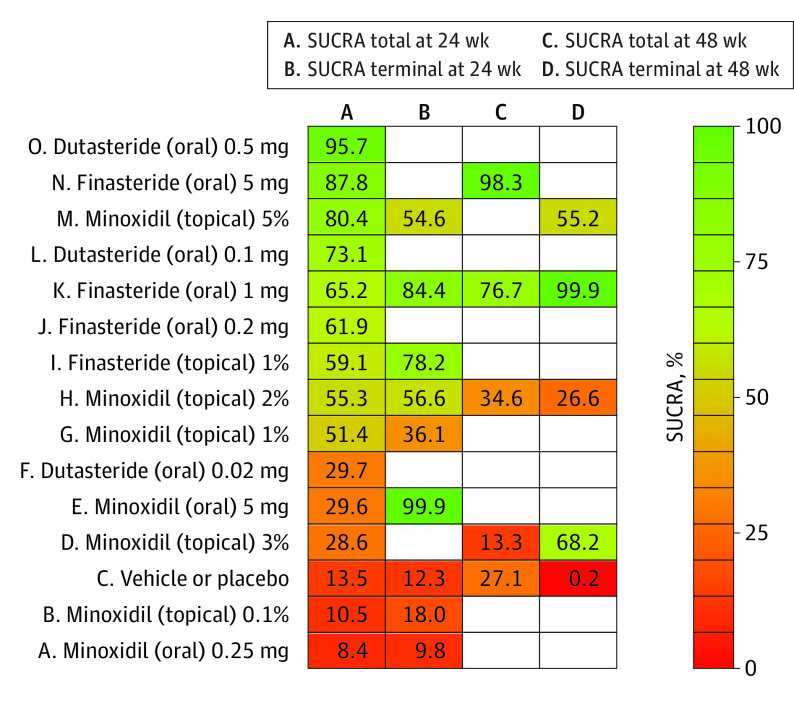
Figure 3. Presentation of Treatments’ Surface Under the Cumulative Ranking Curve (SUCRA) via a Modified Kilim Plot.
Names were prefixed with uppercase letters solely for the purpose of ordering. A treatment’s SUCRA corresponds to its overall rank for efficacy (higher values corresponding to greater efficacy). The vertical and horizontal axes correspond to the treatments and the end points, respectively. For example, SUCRA total at 24 weeks corresponds to change in total hair count (per square centimeters) after 24 weeks of therapy (ie, outcome 1). A color chart for SUCRA values is shown; red and green (which are arbitrarily chosen colors) correspond to lowest and highest SUCRA values, which, in turn, correspond to the least and the most effective treatment per this ranking metric, respectively.

