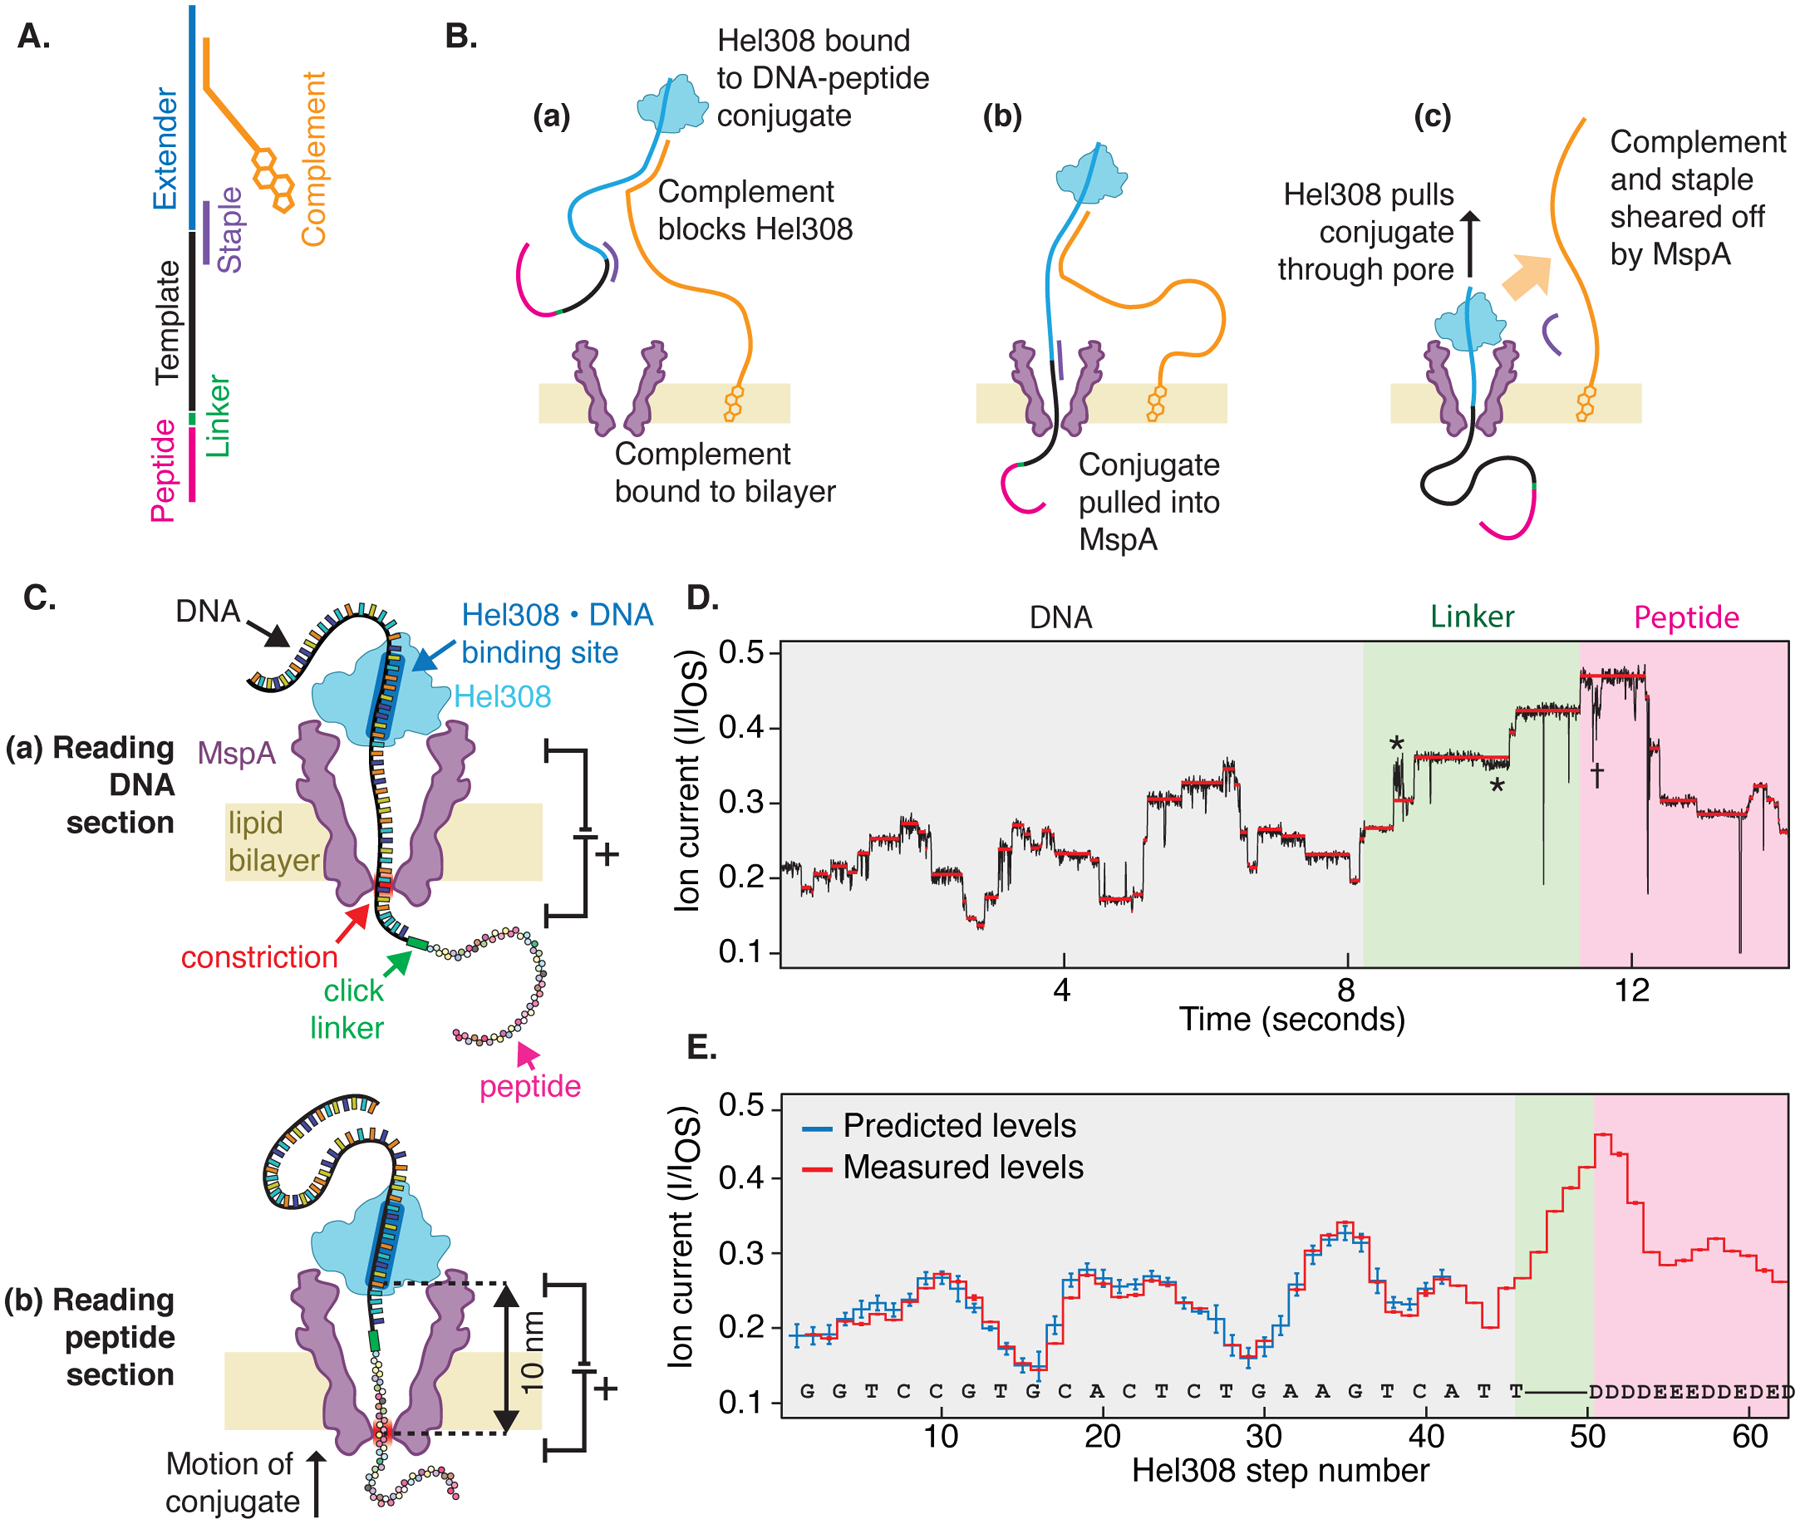
Fig. 1: Reading peptides with a nanopore.

(A) The DNA-peptide conjugate consists of a peptide (pink) attached via a click linker (green) to an ssDNA strand (black). This DNA-peptide conjugate is extended with a typical nanopore adaptor comprised of an extender that acts as a site for helicase loading (blue) and a complementary oligo with a 3’ cholesterol modification (gold). (B) The cholesterol associates with the bilayer as shown in (a), increasing the concentration of analyte near the pore. The complementary oligo blocks the helicase, until it is pulled into the pore (b), causing the complementary strand to be sheared off (c), whereupon the helicase starts to step along DNA. (C) As the helicase walks along the DNA, it pulls it up through the pore, resulting in (a) a read of the DNA portion followed by (b) a read of the attached peptide. (D) Typical nanopore read of a DNA-peptide conjugate (black), displaying step-like ion currents (identified in red). The asterisks * indicate a spurious level not observed in most reads and therefore omitted from further analysis. The dagger † indicates a helicase backstep. (E) Consensus sequence of ion current steps (red), which for the DNA section is closely matched by the predicted DNA sequence (blue). The linker and peptide sections are identified by counting half-nucleotide steps over the known structural length of the linker. Error bars in the measured ion current levels are errors in the mean value, often too small to see. Error bars in the prediction are standard deviations of the ion current levels that were used to build the predictive map in previous work(19).
