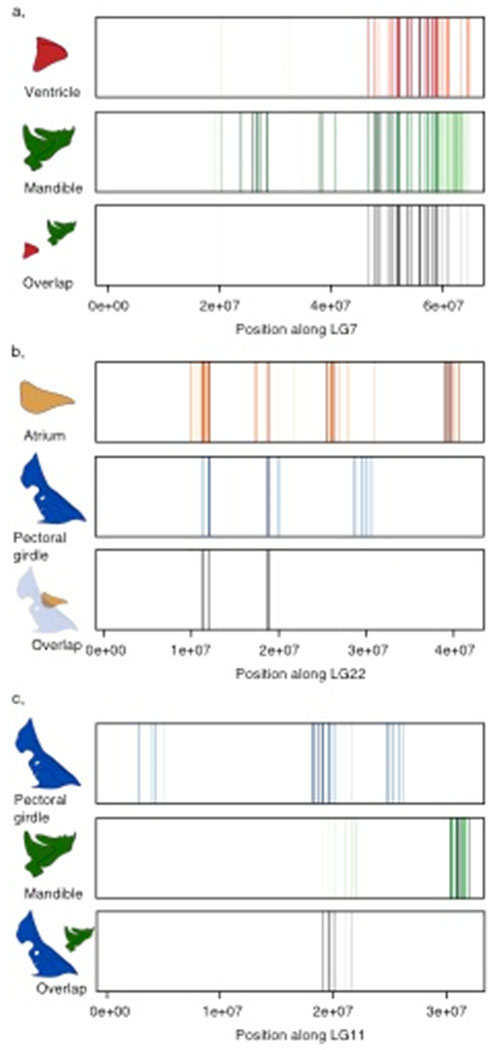
Figure 8.

Fine maps depicting significant QTL markers across a linkage group and the degree of overlap among those QTL markers. Each line reflects a significant marker, and the opacity of a line indicates significance with solid lines representing highly significant markers, while translucent lines reflect less significant markers. Black lines reflect overlapping markers between traits with their opacity determined by their shared significance values. a, comparing the symmetric component of variation between ventricle and mandible. b, comparing the symmetric component of variation between atrium and pectoral girdle. c, comparing the asymmetric component of variation between pectoral girdle and mandible.
