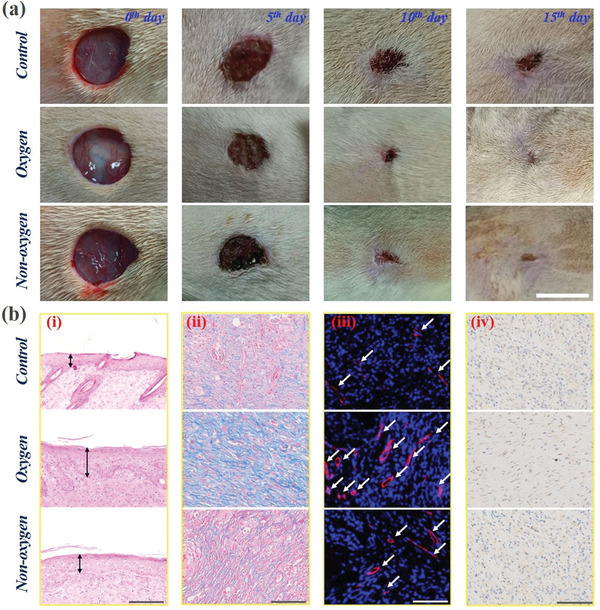
Figure 6.

Investigation of the capacity of the oxygen‐containing porous microparticles in promoting wound healing: a) the changes of the wound areas in the control, oxygen and non‐oxygen groups during the wound healing process. The scale bar is 1 cm; b) histological analysis: (i) the results of H&E staining analysis; (ii) the results of Masson staining analysis; (iii) the results of double immunofluorescent staining of CD31 plus α‐smooth muscle actin (α‐SMA); (iv) the results of immunohistochemistry staining of IL‐6. The scale bars are 200 µm in (i) and 100 µm in (ii, iii, iv).
