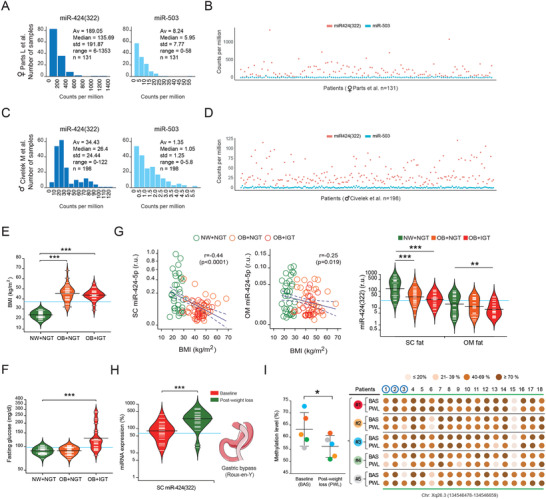
Figure 3.

Impaired miR‐424(322) expression in obese human adipose tissue. Raw miRNA counts per million from RNA‐seq performed on adipose tissue from women (Parts et al.[ 47 ]) A,B) and men (Civelek et al.[ 48 ]) C,D), demonstrating that the miR‐424(322) (but not miR‐503) is consistently expressed in human fat, being especially abundant in women (average out at 190 counts per million). Bean plots depict significant variations in E) body mass indexes (BMI) and F) fasting glucose in participants with normal weight (NW) and normal glucose tolerance (NGT) (green; n = 34), and in obese (BMI ≥ 30 kg m−2) subjects with (red; n = 20) and without (orange; n = 31) impaired glucose tolerance (IGT). G) Scatter dot plots show the association between subcutaneous (SC) and omental (OM) miR‐424(322) expression levels and BMI, while bean plots represent SC and OM miR‐424(322) in subjects segregated according to their BMI (NW < 30 or obese (OB) ≥ 30 kg m−2 particpants) and glucose tolerance. IGT was defined as impaired fasting glucose (≥110 mg dl−1) and/or HbA1c of ≥5.7% (see also in Tables S1 and S2, Supporting Information). H) Changes in SC miR‐424(322) expression at the baseline (red) and upon surgery‐induced weight loss (green) in 23 paired pre‐post fat samples (see also in Table S3, Supporting Information), and I) variations in the methylation degree of DNA residues within the miR‐424(322)/503 loci before/after bariatric surgery (n = 5). Expression values for miR‐424(322) in bean plots are shown as complementary log‐log (cloglog) distribution. Statistical significance for differences between groups was determined by One‐way ANOVA followed by Tukey's honestly significant difference (HSD) post hoc tests (cross‐sectional sample), and by Student's paired t‐test (longitudinal studies). *p < 0.05; **p < 0.01; ***p < 0.001.
