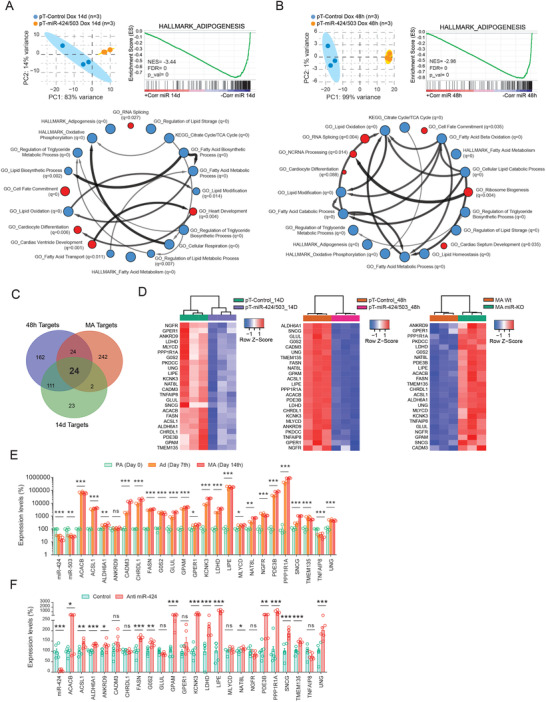
Figure 4.

Global transcriptomics reveal that the miR‐424(322)/503 cluster regulates multiple genetic programs related to adipocyte function. RNA sequencing (RNA‐seq) was performed on engineered human adipocytes with increased levels of the cluster miR‐424(322)/503 A) over the course of differentiation (14 days) and B) during the last 48 h of terminal differentiation. Upper left: principal component analysis (PCA). Upper right and down: gene set enrichment analysis (GSEA) was used to uncover enriched gene signatures from the molecular signatures database (MSigDB). Red and blue circles (nodes) represent different annotations exhibiting positive or negative enrichment, respectively (FDR q‐val < 0.05). Size of nodes reflect p‐value (p‐val < 0.05 for all samples). Arrows interconnect pathways presenting common genes in the leading edge subset for each annotation. C) Venn diagram showing the overlap between potential Targetscan (TS) target genes with differential expressions between Wt/miR‐KO mouse adipocytes (red circle); differentiating human adipocytes with or without induction of the miR‐424(322)/503 cluster (green circle); and adipocytes with or without cluster induction for the last 48 h of differentiation (blue circle). D) Heatmaps show hierarchical clustering analysis for the 24‐gene signature predicted to be regulated by the miR‐424(322)/503. Expression of target gene candidates on E) the 0, 7th and 14th day of the course of adipocyte differentiation (n = 4/time‐point; One‐way ANOVA), and in F) adipose‐derived mesenchymal stem cells (ASC52telo)‐derived adipocytes challenged with an antagomiR directed against the miR‐424 (n = 6/group; Student's t‐test). Data are presented as mean ± S.E.M. PKDCC did not show qRT‐PCR amplification data. *p < 0.05; **p < 0.01; ***p < 0.001. NS, not significant.
