Figure 4.

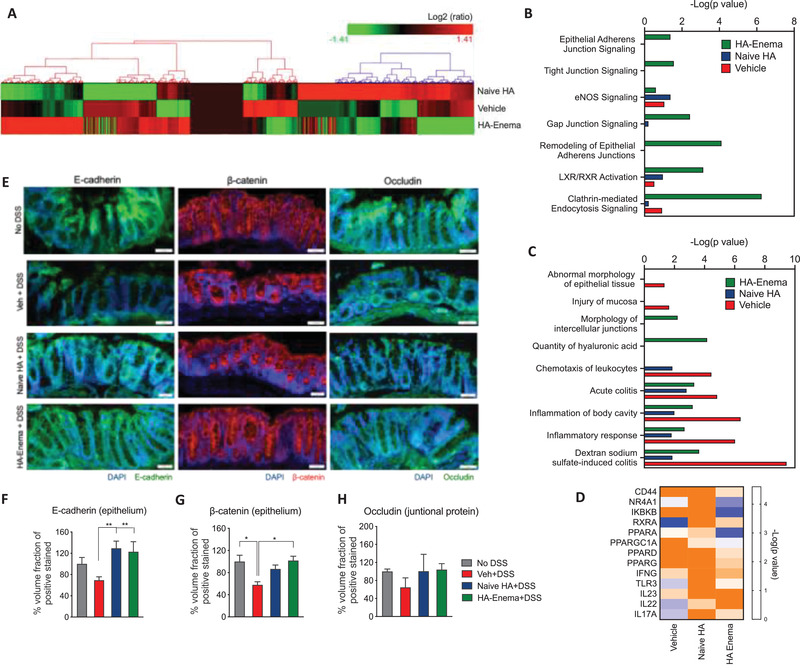
Major proteomic changes in response to HA‐enema suspension treatment in DSS colitis mice model. A) Differentially expressed proteins were shown in heatmaps of log2‐transformed abundance generated by Hierarchical Clustering Explorer 3.0, with red for high expression and green for low expression. B) The quantified activity score of canonical pathways for the vehicle and naïve HA, HA‐enema treatments. C) The quantified activity score of significant cellular/molecular disease pathological pathways for the vehicle and naïve HA, HA‐enema treatment as determined by IPA. D) Heatmap of the top putative upstream regulators increasing (blue) and/or decreasing (orange) involved in modulated cellular functions with a −log 10 p‐value of 1.0 in DSS colitis model and the vehicle (PBS) and naïve HA, HA‐enema treatments. E) Representative immunofluorescence images showing increased E‐cadherin (epithelium), β‐catenin (epithelium), occludin (adherent junctional proteins) at the colitis epithelium site with naïve HA and HA‐enema group compared to vehicle (PBS) control group and F–H) respective quantifications. Statistical analysis was performed using GraphPad Prism software by one‐way ANOVA with Dunnett's multiple comparisons test. Data were expressed as the mean ± SEM. **p < 0.01; *p < 0.05.
