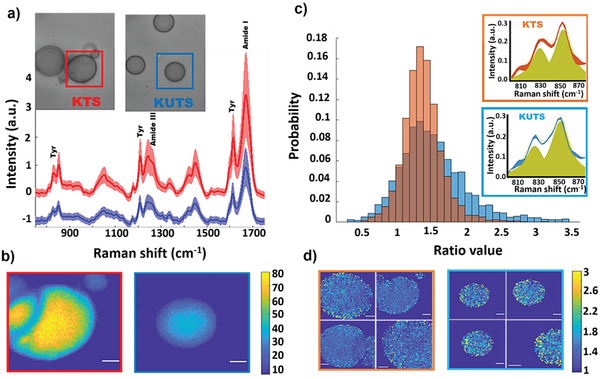
Figure 2.

In situ BCARS imaging of protein–protein interactions in KTS/KUTS condensates. a) Fingerprint region spectra of KTS (red) and KUTS (blue). Shaded areas indicate the standard deviations (S.D.) of all the pixels within the measured sample area and solid line is the average. Insets show the brightfield images of measured areas. b) BCARS images of KUTS and KTS condensates boxed in (a) with same color coding. Pixel contrast is calculated from the Amide I integrated intensity and the pixel size is 0.3 × 0.3 µm2; color bar shows the Amide I intensity value in arbitrary units. Scale bar is 3 µm. c) Histogram of the tyrosine ratio (I 850/I 830) for KUTS and KTS. Data are from individual pixels pooled across four samples of each type. Histograms are area‐normalized such that the integrated probability is 1. Insets show tyrosine doublet average spectra with fitted peaks (yellow) and the S.D. between samples is shown by the width of the red or blue lines. d) BCARS images of four KTS (framed in orange) and four KUTS samples (framed in blue). Pixel contrast is calculated by tyrosine doublet integrated intensity ratio, and the color bar shows the ratio value from 1 to 3. Scale bar is 3 µm. All microscopy was performed at room temperature.
