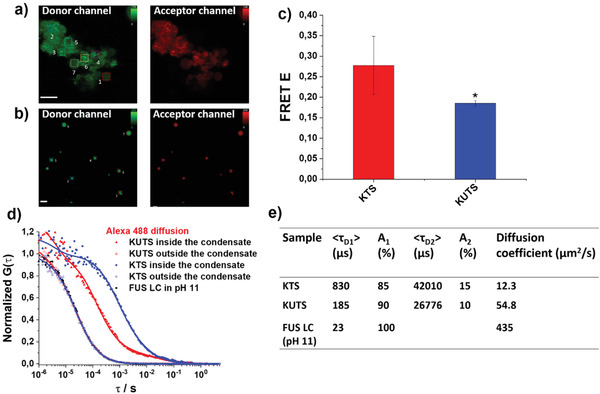
Figure 4.

FUS LC chain–chain interactions and molecular mobility are distinct in KTS and KUTS condensates. a,b) Donor (Cy3, green) and acceptor (Cy5, red) channels of KTS (a) and KUTS (b) FUS LC condensates measured for FRET AB measurements. Boxed regions show the regions of interest (ROIs) that were selected to calculate the FRET efficiency, E = (Donor Intpost − Donor Intpre)/Donor Intpost, of each sample. Scale bar is 10 µm. c) Graph shows E for KUTS (red) and KTS (blue) from different n = 7 ROIs calculated in a point‐by‐point manner. Error bars are S.D., and * indicates statistically significant differences (p < 0.05). d) Normalized fluorescence correlation G(τ) curves of Alexa 488 diffusion in KTS and KUTS, respectively. All curves were fit to Equation S1, Supporting Information. e) Table showing average correlation decay times, percent contribution, and diffusion coefficient of Alexa 488 in different samples. The diffusion coefficients were calculated from the decay time with larger contribution to the signal.
