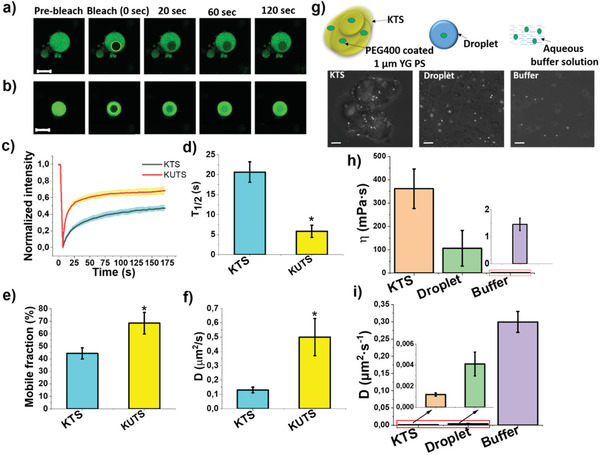
Figure 5.

Protein and macroscopic mobility are hindered in KTS condensates. a,b) Representative images from FRAP experiments of 0.01 mol % Cy3‐labeled FUS LC‐doped KTS and KUTS (times indicate seconds post bleach). The yellow circle highlights the punctum that underwent targeted bleaching. Scale bar is 10 µm. c) Normalized fluorescence intensity of KTS and KUTS over time with thick lines indicating averages over ten samples and colored shaded areas showing the S.D. d–f) Bar graphs showing half‐time fluorescence recovery (T 1/2) (d), mobile fraction (%) distribution (e), and diffusion coefficient values (f) in various samples. Error bars are S.D. g) Cartoon representation of precoated PEG 400 yellow–green emitting polystyrene beads encapsulated in KTS, liquid condensates, and buffer. Brightfield images of KTS condensates and canonical FUS LC droplets containing microspheres. Scale bar is 10 µm. h,i) Bar graphs showing dynamic viscosity (h) and diffusion coefficient (i) for all populations of beads in different FUS LC samples. Error bars are S.D. (more than 20 beads per sample) in all panels, and statistically significant differences (p < 0.05) compared to KTS are indicated by “*”.
