Figure 5.

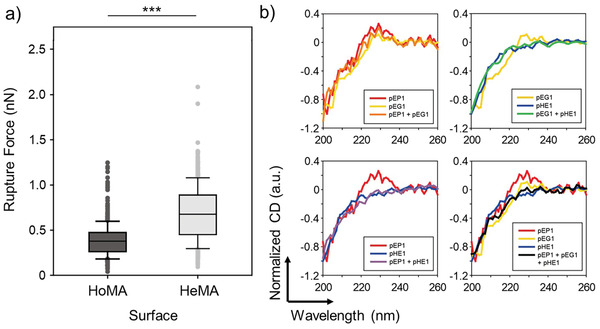
Nonspecific binding on the two hetero‐HMAs: a) Rupture forces between BSA‐immobilized probes on HoMA and HeMA, as quantified using AFM force measurements. b) CD spectra of the peptides (individual or in mixture) in PBS. The strong negative bands at ≈200 nm and the disappearance of the peak at 220–230 nm are indicative of structural changes due to the interpeptide interaction. Significance levels are indicated as * p < 0.05, ** p < 0.01, and *** p < 0.001, which are analyzed using the Mann–Whitney U test.
