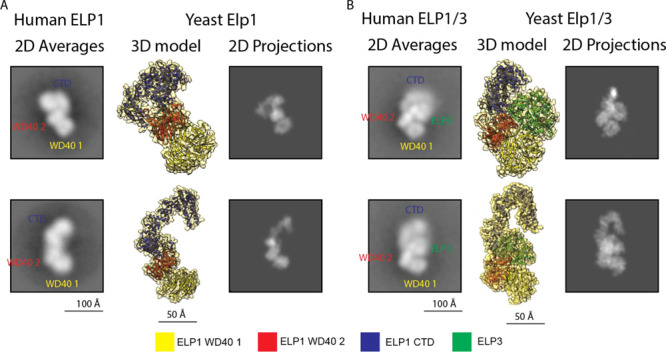
Figure 2.

Structural comparison of hELP1 and ELP1/3 with their yeast orthologues. (A) Left: Representative 2D class averages of hELP1 particles with labels denoting the approximate location of hELP1 domains. Centre: 3D model of monomeric yElp1 (PDB: 6QK7) in orientations corresponding to the 2D averages to the left. Right: 2D projections generated from the 3D models in the center. (B) Left: Representative 2D class averages of hELP1/3 particles with labels denoting the approximate location of hELP1 domains and hELP3. Centre: 3D model of monomeric yElp1/3 (PDB: 6QK7) in orientations corresponding to the 2D averages to the left. Right: 2D projections generated from the 3D models in the center. A color legend corresponding to the 3D models is shown at the bottom.
