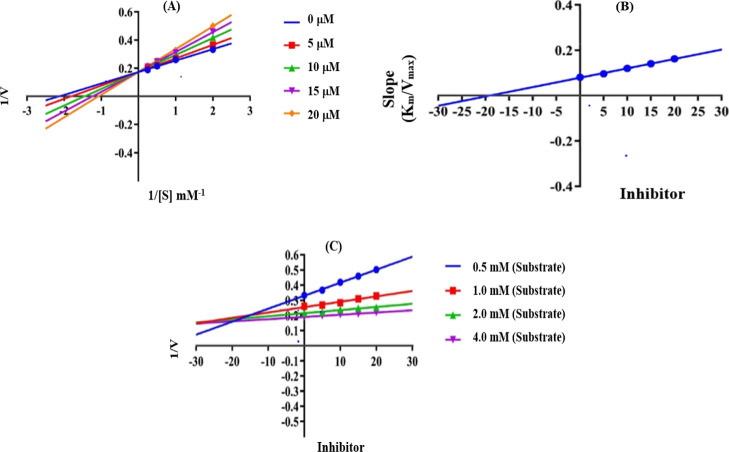
Figure 5.
Enzyme kinetics of analog 2g, (A) Lineweaver Burk plot, (B) secondary replot (Lineweaver Burk), and (C) Dixon plot for the urease inhibition activity. Note: Vmax is the maximum velocity of enzymatic activity at a 20 mM inhibitor concentration, Km is the Michaelis–Menten constant at a 20 mM inhibitor concentration, and Ki (μM) is the value calculated from the Dixon plot.

