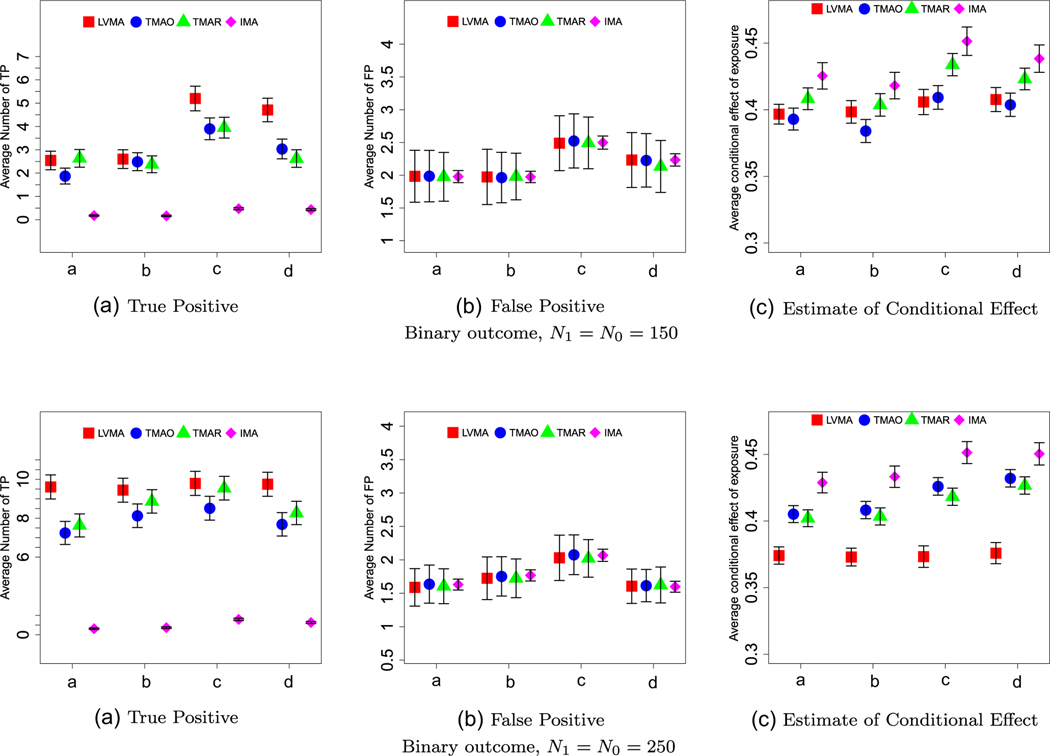
FIGURE 4.
Binary outcome and large factor effects (λ1 = 0.3). The panels, labeled A-C, show the average number of true positives (TP), the average number of false positives (FP), and the average estimate of the direct effect for the four methods (red = LVMA; blue = TMAO; green = TMAR; purple = IMA) and for four scenarios (a: βEF,1 = 0.4, λ0 = 0.4; b: βEF,1 = 0.4, λ0 = 0.5; c: βEF,1 = 0.5, λ0 = 0.4; d: βEF,1 = 0.5, λ0 = 0.5) based on 1000 simulations. Top and bottom panel are for studies with N = 300 and N = 500 subjects, respectively. The whiskers show two standard errors around the average estimates.

