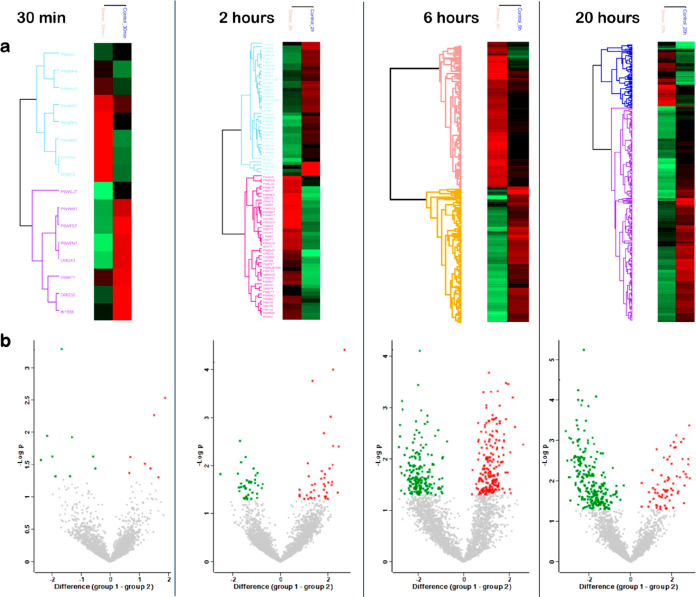
Figure 2.
Quantitative proteomic analysis after exposure to nitrosative stress for each time point. (a) Heat maps of DA proteins after 30 min, 2 h, 6 h, and 20 h exposure to DETA/NO versus the control. The color code indicates the abundance of each protein from bright red (more abundant) to light green (less abundant). (b) Volcano plots of log2 fold changes for DA proteins after 30 min (7 up, 9 down), 2 h (41 up, 38 down), 6 h (193 up, 182 down), and 20 h (69 up, 237 down) exposure to DETA/NO versus the control. Red dots correspond to upregulated proteins and green dots to downregulated proteins. The list of DA protein in each time point is provided in Table S4a–d.

