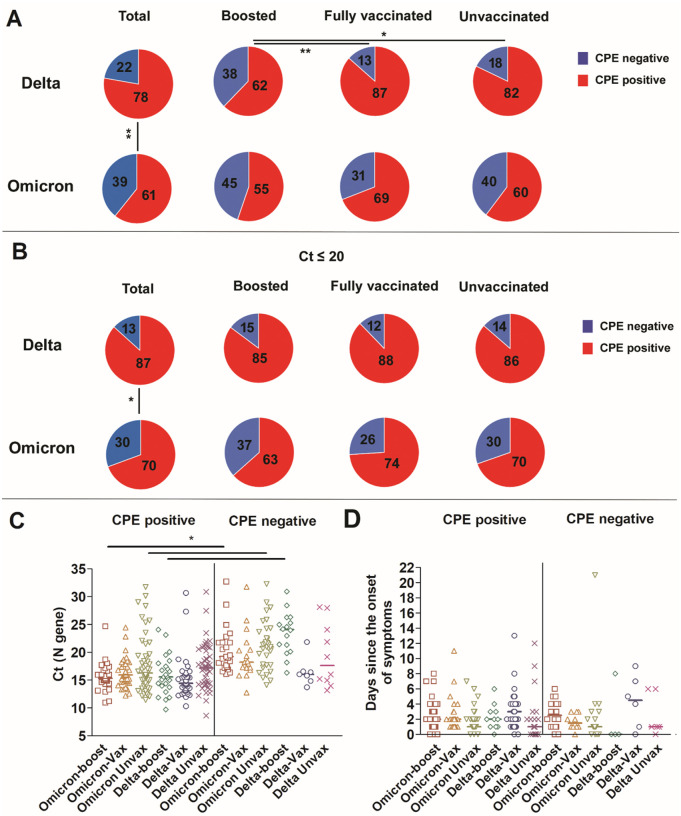
Figure 3. Recovery of infectious virus from respiratory samples of patients infected with Delta or Omicron.
A) Percent CPE positives and negatives for Delta and Omicron; total, patients who received a booster, fully vaccinated, and unvaccinated groups. Chi-squared test * p < 0.05, ** p < 0.001. B) Percent CPE positives and negatives for Delta and Omicron; total, patients who received a booster, fully vaccinated, and unvaccinated groups with Ct values less than 20. Chi-squared test * p < 0.05. C) Ct range and medians of Delta and Omicron samples CPE positive and negative. One-way ANOVA * p < 0.05 D) Distribution of sample collection time from each group in relation to days from the onset of symptoms.

