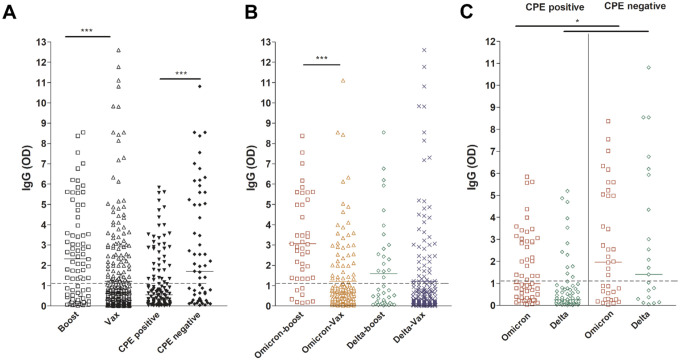
Figure 4. SARS-CoV-2 IgG levels in upper respiratory samples of infected vaccinated patients.
Boost, patients with booster dose; Vax, fully vaccinated patients who didn’t receive a booster dose. Dashed lines demarcate the limit of borderline and negative ELISA results as specified per assay’s package insert.

