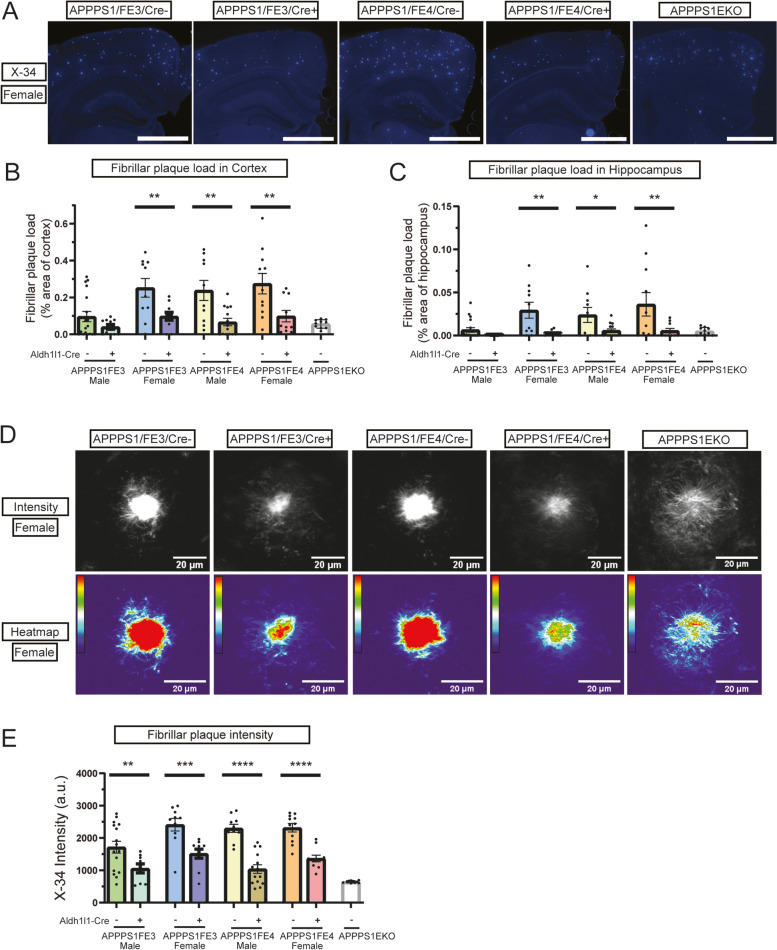
Fig. 2.
Reducing astrocytic apoE decreases fibrillar plaque levels and plaque intensity. A Fibrillar amyloid plaque staining in the cortex and hippocampus of female Cre-, Cre+, and APPPS1EKO mice. Representative images are of X-34 (blue) stained female brain sections. Scale bars = 1000 μm (B) Fibrillar plaque load in the cortex of Cre-, Cre+, and APPPS1EKO mice. Percent of cortex area covered by fibrillar plaque was determined by analyzing X-34 stained brain sections (n = 10–18). C Fibrillar plaque load in hippocampus of Cre-, Cre+, and APPPS1EKO mice. Percent of hippocampus area covered by fibrillar plaque was determined by analyzing X-34 stained brain sections (n = 10–18). D Intensity of fibrillar amyloid plaques in Cre-, Cre+, and APPPS1EKO mice. Representative images are of female X-34 stained amyloid plaques. Scale bars = 20 μm. E Measure of average pixel intensity of X-34 stained fibrillar plaques in the cortex of Cre-, Cre+, and APPPS1EKO mice (n = 9–16). A-E * p ≤ 0.05, ** p ≤ 0.01, *** p ≤ 0.001, and **** p ≤ 0.0001; three-way ANOVA and uncorrected Fisher’s LSD test in (B), (C), and (E). Data are expressed as mean ± SEM. See Supplementary Table 1 for detailed statistics

