Fig. 6.
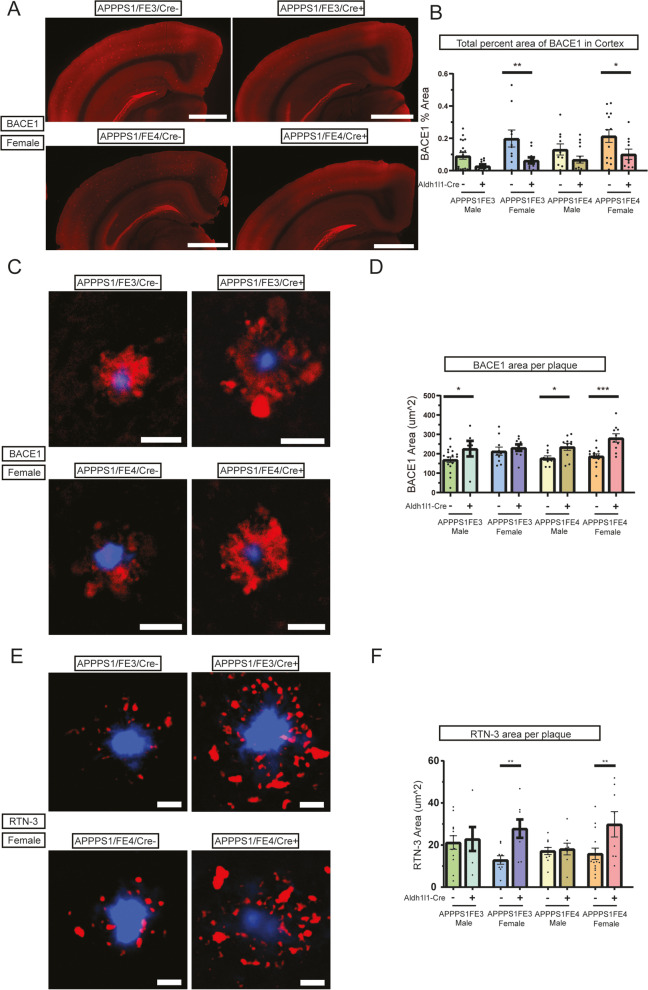
Neuritic dystrophy is increased around plaques, but decreased overall, with a reduction in astrocytic apoE. A Dystrophic neurite staining in the cortex and hippocampus of Cre- and Cre + mice. Representative images are of brain sections immunostained using an anti-BACE1 antibody (red). Scale bars = 1000 μm. B Level of neuritic dystrophy in the cortex of Cre- and Cre + mice. Percent of cortical area covered by dystrophic neurites was determined by analyzing BACE1 stained brain sections (n = 10–19). C Dystrophic neurites around fibrillar amyloid plaques in Cre- and Cre + mice (BACE1). Representative images are of BACE1 immunostaining (red), using an anti-BACE1 antibody, around X-34 stained (blue) amyloid plaques. Scale bars = 20 μm. D Level of neuritic dystrophy around fibrillar amyloid plaques in Cre- and Cre + mice (BACE1). Percent of area covered by dystrophic neurites around fibrillar amyloid plaques was determined by analyzing the level of BACE1 staining within 15 μm of X-34 stained plaques (n = 6–18). E Dystrophic neurites around fibrillar amyloid plaques in Cre- and Cre + mice (RTN-3). Representative images are of female RTN-3 immunostaining (red), using an anti-RTN-3 antibody, around X-34 stained (blue) amyloid plaques. Scale bars = 20 μm. F Level of neuritic dystrophy around fibrillar amyloid plaques in Cre- and Cre + mice (RTN-3). Percent of area covered by dystrophic neurites around fibrillar amyloid plaques was determined by analyzing the level of RTN-3 staining within 15 μm of X-34 stained plaques (n = 6–14). A-D * p ≤ 0.05, ** p ≤ 0.01, and **** p ≤ 0.0001; three-way ANOVA and Sidak’s post hoc test in (B); three-way ANOVA and uncorrected Fisher’s LSD test in (D) and (F). Data are expressed as mean ± SEM. See Supplementary Table 1 for detailed statistics

