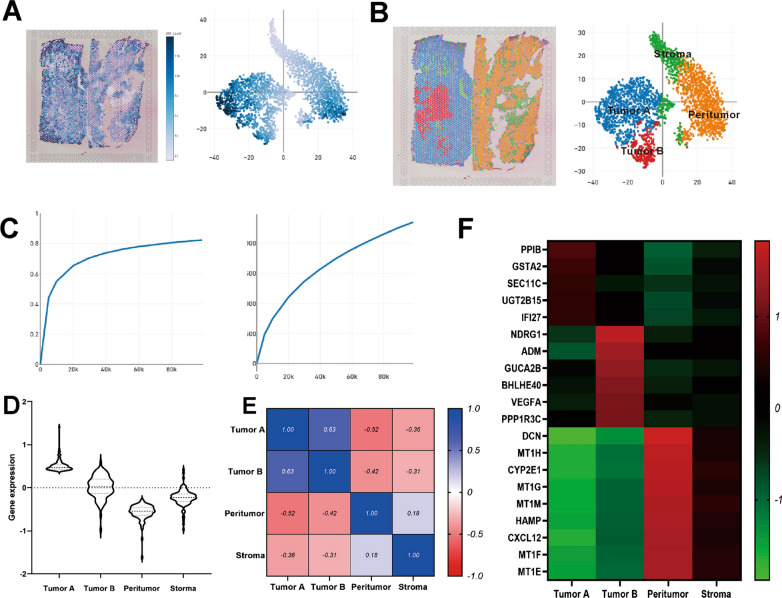
Fig. 2.
Spatial gene expression heterogeneity within the case 1 tissue sample. A Tissue plot with spots coloured by UMI count and t-SNE projection of spots coloured by UMI counts. B Tissue plot with spots coloured by clustering and t-SNE projection of spots coloured by clustering. C Sequencing saturation and median genes per spot. D Violin plots displaying the expression of the top 100 DEGs in the 4 main clusters. E Spearman correlation between tumour area versus peritumour area. F Heatmap showing the expression levels of specific markers in 4 clusters

