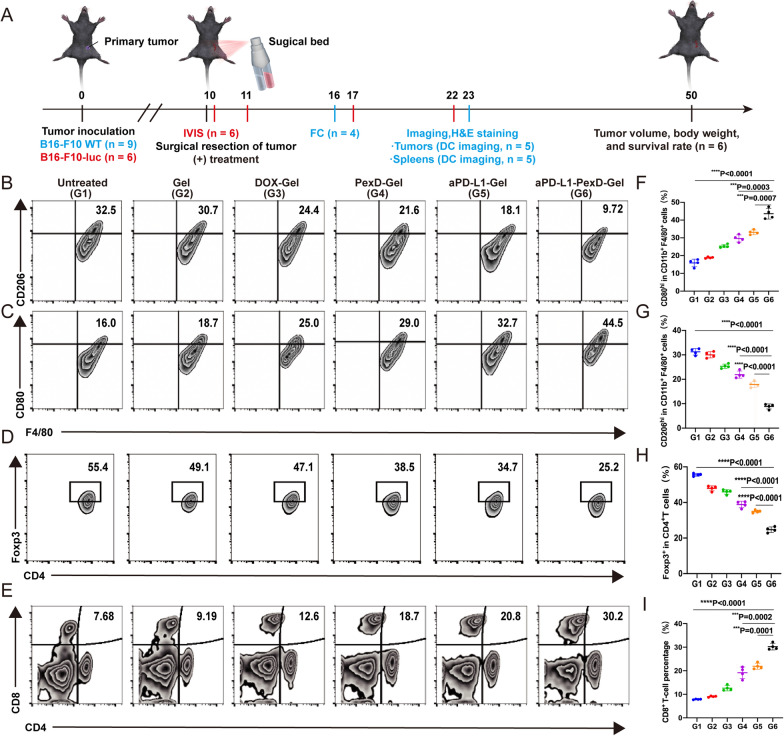
Fig. 4.
Six days after treatment, immune responses induced by aPD-L1-PexD-Gel B16-F10 tumours were harvested from mice. A Schematic diagram of treatment in a distal surgical tumour model. (B16-F10-WT: wild type B16-F10 melanoma cells; B16-F10-luc: luciferase-tagged B16-F10 melanoma cells; IVIS: in vivo imaging system; FC: flow cytometry analysis; DC imaging: digital camera imaging). B Representative flow cytometry analysis images of M2 macrophages (CD206hi) and C M1 macrophages (CD80hi) on gated F4/80+ CD11b+ CD45+ cells. D Representative flow cytometric analysis of CD4+ Foxp3+ T cells on CD3+ cells. E Representative flow cytometric analysis of CD8+ T cells on CD3+ cells. F Relative quantification in B. The data are expressed as the mean ± SD (n = 4). G Relative quantification in C is expressed as the mean ± SD (n = 4). H Relative quantification in D is expressed as the mean ± SD (n = 4). I Relative quantification in E is expressed as the mean ± SD (n = 4). F–I *P < 0.05; **P < 0.01; ***P < 0.001; ****P < 0.0001

