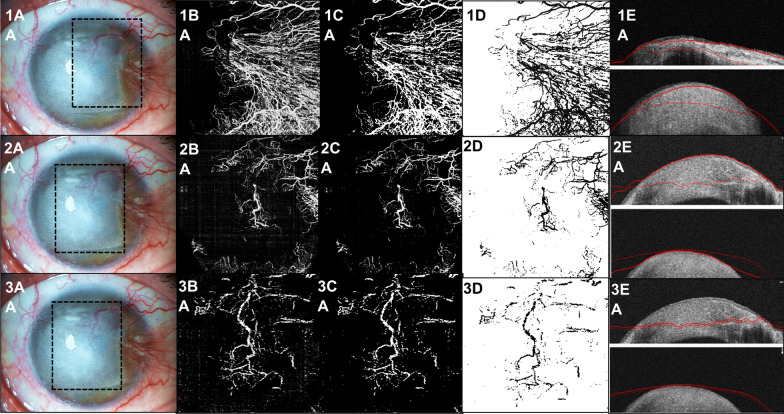
Fig. 5.
Example of a dense cornea herpetic leucoma with abnormal neovascularization visualized in AS SLP (1A, 2A, 3A). OCTA image is able to demonstrate the extent of neovascularization at nasal side and to discriminate between larger and smaller vessels (1B). Images are imported as 8-bit color images in the ImageJ software, and the contrast is enhanced to reduce the surrounding noise (1C). The image was converted to binary using locally calculated thresholds (1D). Representative localization at the level in which OCTA was acquired (150–200 µm). The C-scans were determined by two parallel lines automatically defined, with the default thickness of 50 µm, with the posterior possibility of manual modifications (1E). The same analyze was made to central and anterior neovascularization (50–150 µm) (2B, 2C, 2D, 2E) and central and deep neovascularization (250–300 µm) (3B, 3C, 3D, 3E), that seems to have more vessels than anterior evaluation

