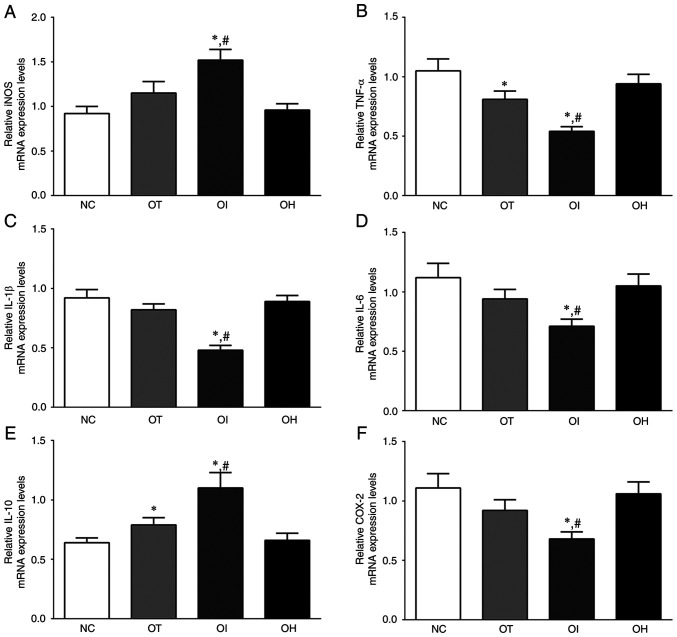
Figure 2.
Expression levels of inflammation and oxidative-reduction related mRNA in H9c2 cells using reverse transcription-quantitative PCR. (A) iNOS, (B) TNF-α, (C) IL-1, (D) IL-6, (E) IL-10 and (F) COX-2 in H9c2 cells. Data are presented as the mean ± SD. Each experiment was repeated three times independently. *P<0.05 vs. NC group; #P<0.05 vs. OT group. DHE, dehydrocostus lactone; TXNIP, thioredoxin-interacting protein; NC, negative control; OT, DHE treatment group; OI, DHE treatment combined with the TXNIP inhibition group; OH, DHE treatment combined the with TXNIP overexpression group; iNOS, inducible nitric oxide synthase; COX-2, cyclooxygenase-2.

