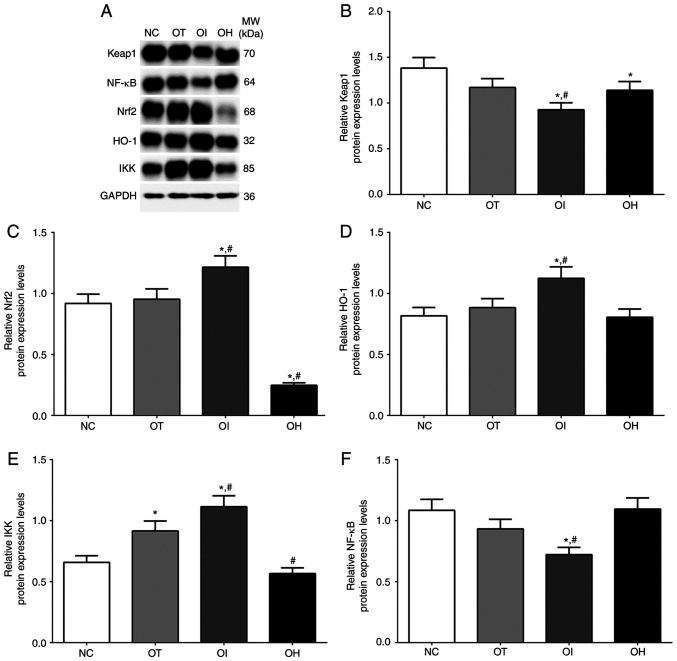
Figure 5.
Protein expression levels of proinflammation proteins in heart tissue of mice using western blot method. (A) Western blotting analysis and quantitative analysis of (B) Keap1, (C) Nrf2, (D) HO-1, (E) IKK and (F) NF-κB. Data are presented as the mean ± SD. Each experiment was repeated three times independently. *P<0.05 vs. NC group. #P<0.05 vs. OT group. DHE, dehydrocostus lactone; TXNIP, thioredoxin-interacting protein; NC, negative control; OT, DHE treatment group; OI, DHE treatment combined with TXNIP inhibition group; OH, DHE treatment combined with TXNIP overexpression group; TLR, toll-like receptor; HMGB1, high mobility group protein B1; NLRP3, NOD-, LRR- and pyrin domain-containing protein 3; MW, molecular weight.

