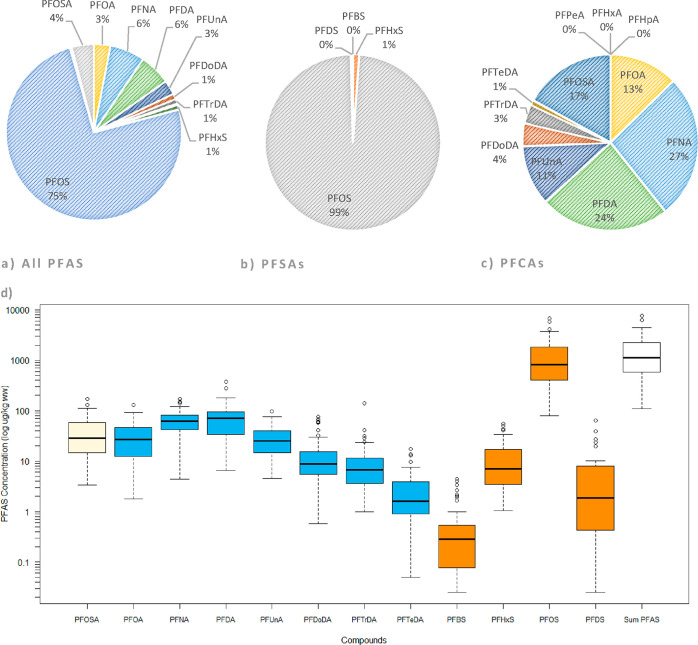
Figure 2.
Proportion of individual substances in relation to the total of (a) all PFASs (PFBS, PFDS, PFPeA, PFHxA, and PFHpA represented 0% of the profile and are consequently not shown) (b) perfluoroalkyl sulfonic acids (PFSAs), and (c) perfluoroalkyl carboxylic acids (PFCAs). Compounds are denoted by their abbreviation see Table 1 for full names. (d) Concentrations of compounds with detection frequency 80% and above. Compounds are denoted by their abbreviation. Concentrations are recorded in μg/kg ww and plotted on a log scale. Compounds are color coded; beige = perfluorooctane sulfonamide (PFOSA), blue = perfluoroalkyl carboxylic acids (PFCAs), orange = perfluoroalkyl sulfonic acids (PFSAs), and white: sum PFASs; and presented in order of the carbon chain length within each group. Concentrations are presented as a boxplot; the thick black line indicates the median concentration, the lower and upper extents of the box indicate the 25th (Q1) and 75th (Q3) percentiles of the data distribution, whiskers show the lowest and highest values excluding outliers, and circles indicate outliers (1.5× the interquartile range).

