Figure 3.
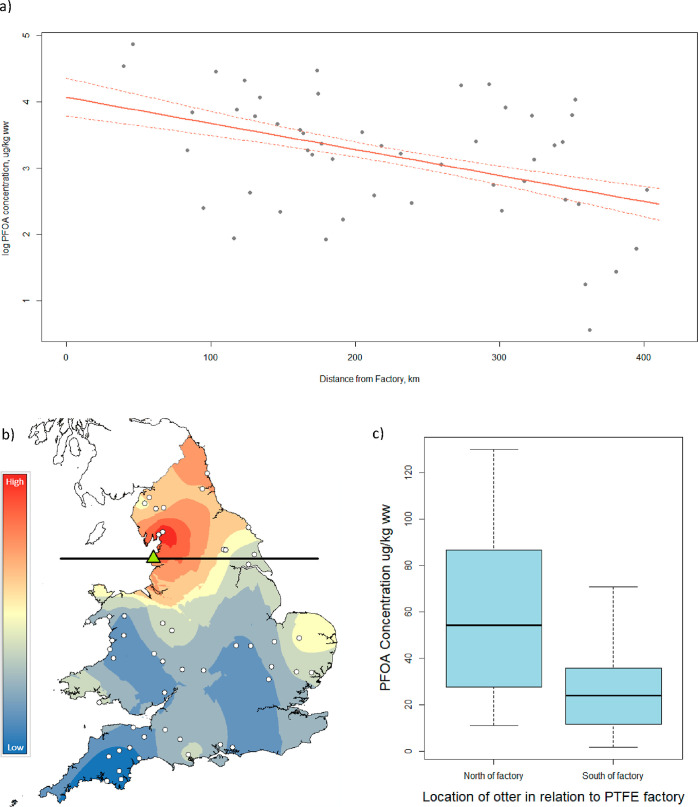
(a) Model-predicted PFOA concentrations (red lines, ± SE) with distance from the factory producing PTFE. Other variables in the model are controlled (WWTW and arable land, see statistical methods). (b) Heatmap showing PFOA concentrations, measured in μg/kg ww. Red indicates high values and dark blue indicates low. White dots show locations of otters used in analysis. Green triangle shows the location of the factory, black line indicates the latitude of the factory. (c) Concentrations of PFOA in otters north and south of factory latitude line. Concentrations are measured in μg/kg ww. Concentrations are presented as a boxplot; the thick black line indicates the median concentration, the lower and upper extent of the box indicate the 25th (Q1) and 75th (Q3) percentiles of the data distribution, whiskers show the lowest and highest values excluding outliers.

