
Figure 3.
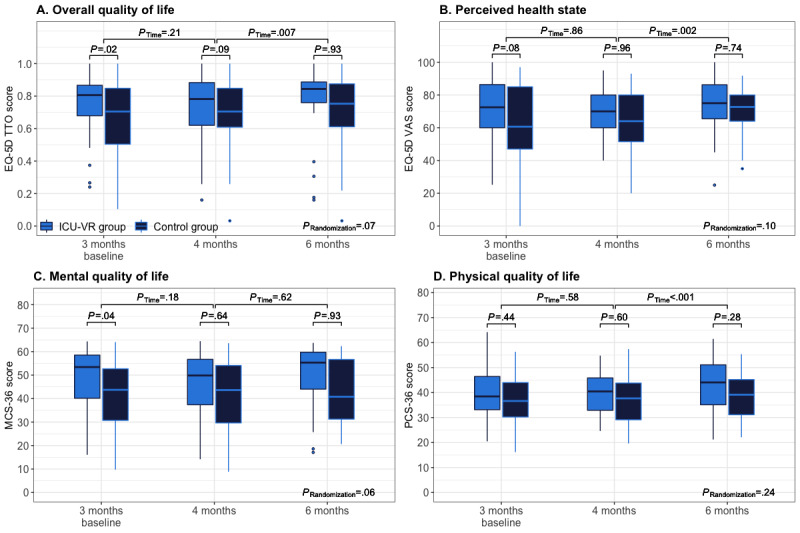
Quality of life outcomes. Boxplots of the overall quality of life (A), perceived health state (B), mental quality of life (C), and physical quality of life (D). Overall quality of life was expressed as the EQ-5D TTO score, the perceived health state as the EQ-5D VAS score, and the mental and physical quality of life as the mental and physical component scales of the SF-36, respectively. Differences between randomization groups at each follow-up time point and between follow-up time points (p, Time) and throughout the follow-up (p, Randomization) were analyzed using mixed-effects linear (severity) or logistic (prevalence) regression models. EQ-5D: European Quality of Life, 5 dimensions, ICU-VR: intensive care unit–virtual reality, MCS-36: Mental Component Summary, 36 items, PCS-36: Physical Component Summary, 36 items, TTO: trade time-off, VAS: visual analog scale.