
Figure 4.
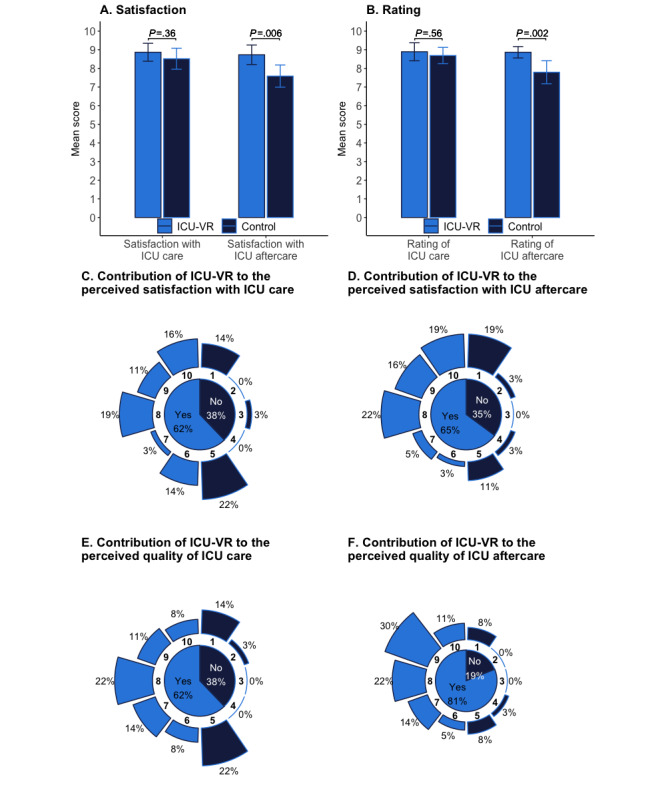
Perspectives on ICU-VR. Bar charts of the mean satisfaction score (A) and rating (B) of ICU care (left) and ICU aftercare (right) in the ICU-VR and control group, wherein the error bars indicate the 95% CI of the scores. The contribution of ICU-VR to the perceived satisfaction with ICU care (C) and ICU aftercare (D) and the contribution of ICU-VR to the perceived quality of ICU care (E) and ICU aftercare (F) are presented as combined pie/bar charts, indicating the percentage of patients in the ICU-VR group who gave a score above 5 (inner circle) and the percentage of patients in the ICU-VR group giving a certain score (outer circle). ICU: intensive care unit, ICU-VR: intensive care unit–virtual reality.