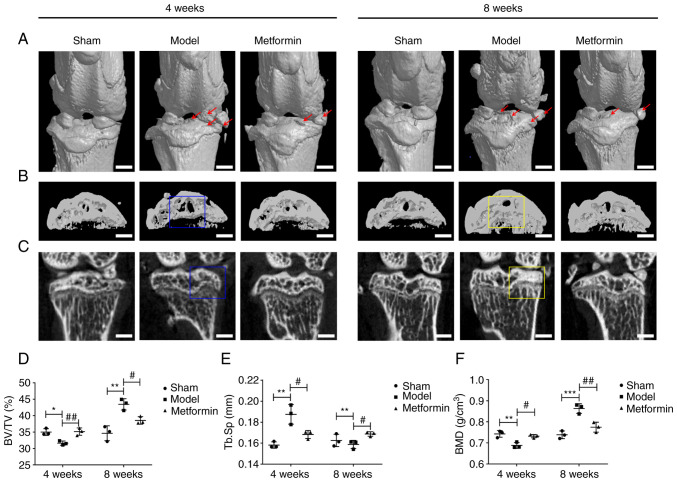
Figure 3.
Metformin can improve subchondral bone remodelling in a destabilization of the medial meniscus model. (A) Representative micro-CT images. Osteophyte and cartilage degeneration are marked by red arrows. Scale bar=2,000 µm. (B) Micro-CT two-dimensional scan of tibial subchondral bone. Scale bar=2,000 µm. (C) Micro-CT two-dimensional reconstructions of tibial subchondral bone. Scale bar=2,000 µm. Subchondral bone loss in the tibia is highlighted using a blue box. Increases in bone mass and bone sclerosis are highlighted using a yellow box. Quantification of bone morphological parameters (D) BV/TV, (E) Tb.Sp and (F) BMD. One-way ANOVA followed by Tukey's multiple comparison test was used to compare data among groups after testing the data for homogeneity of variance. *P<0.05; **P<0.01 and ***P<0.001; #P<0.05; ##P<0.01. BV/TV, bone volume fraction; Tb.Sp, trabecular separation; BMD, bone mineral density.

