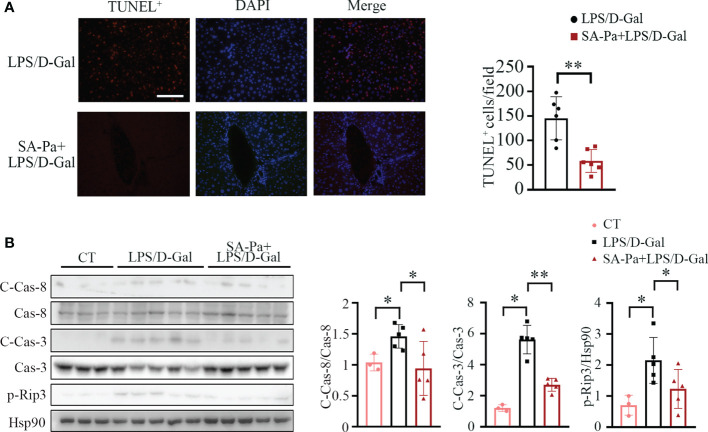
Figure 6.
SA-Pa attenuated cell death after the LPS/D-Gal injury. (A) Representative pictures for TUNEL+ staining in the liver (left) and quantitative results (right). (B) Western blots (left) and quantitative results (right) for C-Casp-8/Cas-8 (cleaved-Caspase-8/Caspase-8), C-Cas-3/Cas-3, and p-Rip3 levels. (CT group, n = 3; LPS/D-Gal group, n = 5–6; SA-Pa group, n = 5–6; *p < 0.05; **p < 0.01; scale bar = 100 μm).

