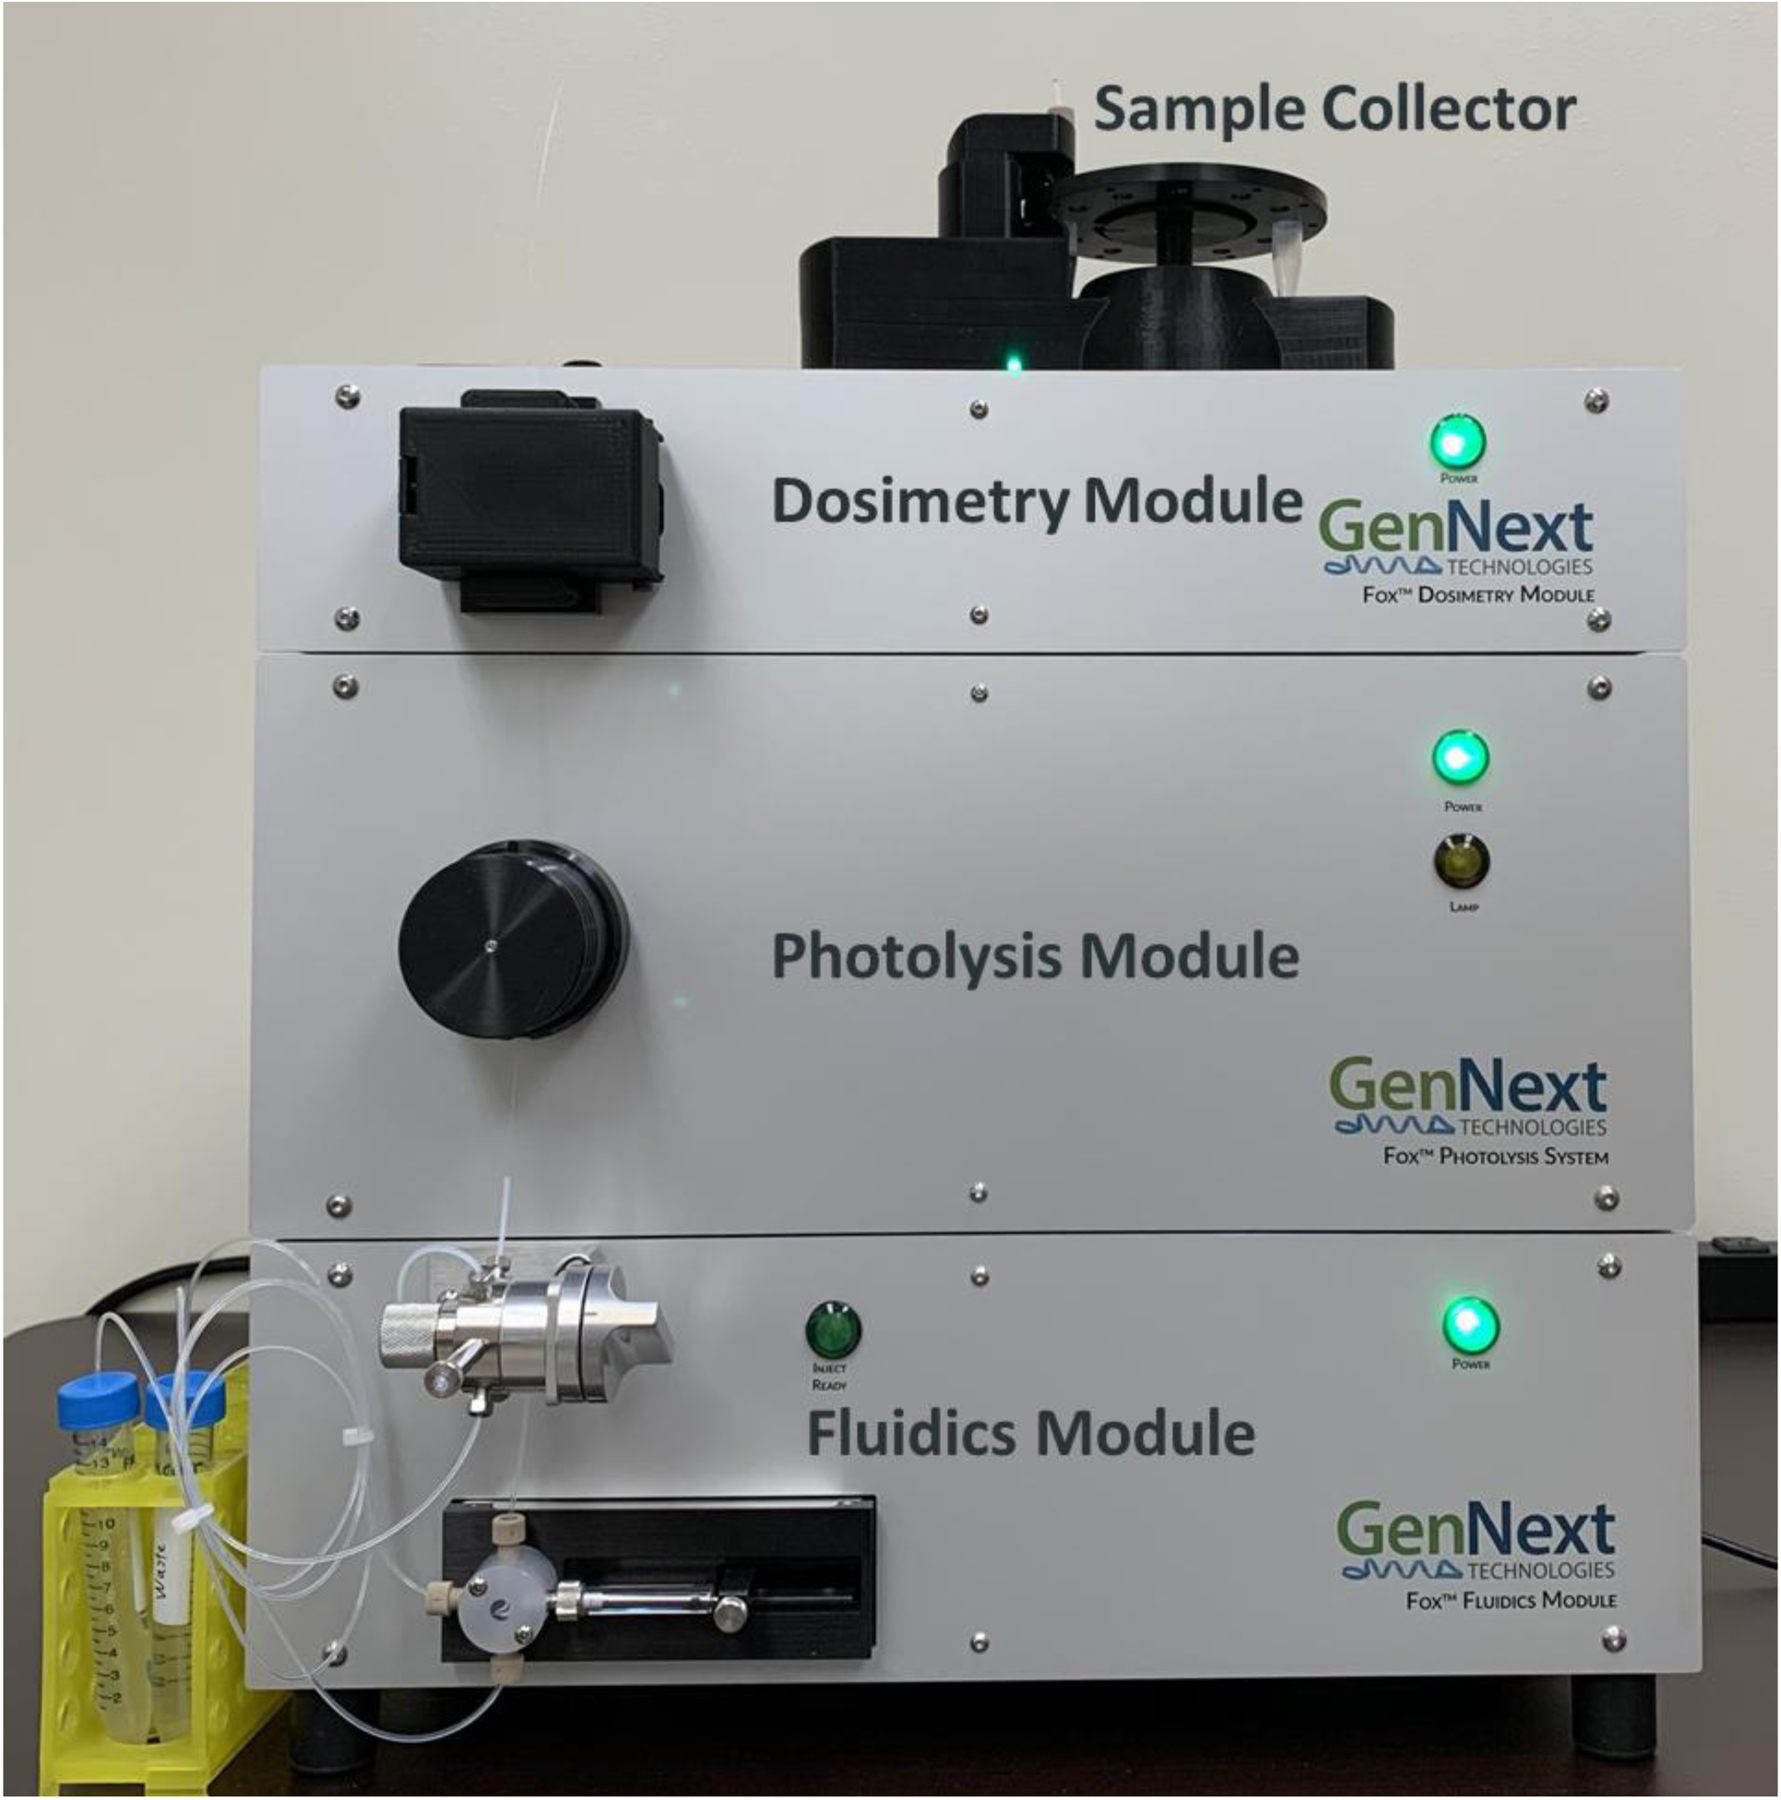
Figure 1. FOX Protein Footprinting System.

Sample mixed with hydrogen peroxide and adenine internal standard radical dosimeter is introduced via flow injection through an injection port in the Fluidics Module (bottom). Sample is then pushed by a syringe pump upwards through a fused silica capillary through the FOX flash cell in the Photolysis Module (middle), where the sample is oxidized by photolysis of hydrogen peroxide. Sample is immediately carried to the Dosimetry Module (top), where the UV absorbance of the adenine dosimeter is measured at 265 nm. Finally, sample is deposited into quench solution in the computer-controlled sample collector (atop instrument), with carrier buffer diverted to waste.
