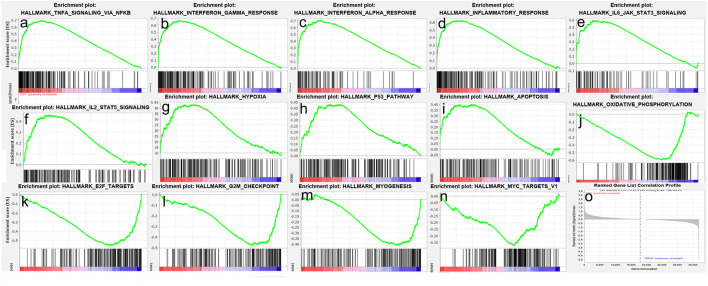
Figure 2.
Gene set enrichment analysis (GSEA) of SARS-CoV-2 infection in hiPSC-CMs. (a–i) Nine representative gene sets enriched in hiPSC-CMs with SARS-CoV-2 infection; (j–n) Five representative gene sets inhibited in hiPSC-CMs with SARS-CoV-2 infection; (o) Ranked gene list correlation profile. The red color indicates the “COV” group, the blue color indicates the “MOCK” group, the black line indicates the genes in the GENE SET, and the green line consists of the enrichment fraction of each gene.

