
Figure 1.
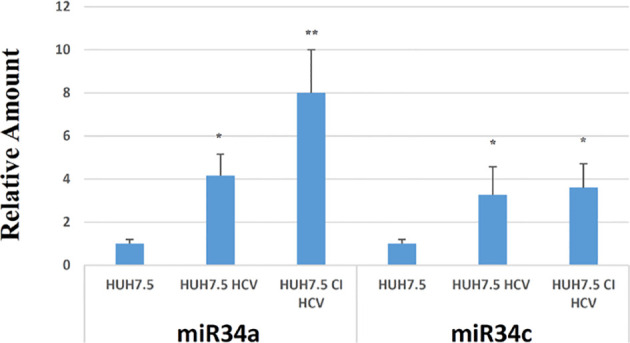
RT-PCR analysis for miR34a and miR34c in empty Huh7.5 (control), HCV infected and Huh7.5 CI. Values are expressed as fold change vs. the control. Data are representative of experiments performed in triplicate on three different samples (p value * ≤0.05, ** ≤0.005).