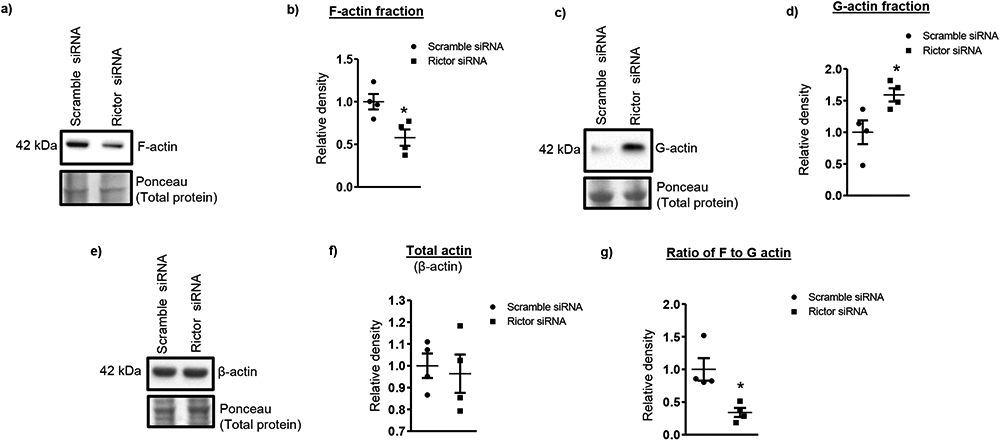
Figure 4. mTORC2, but not mTORC1 regulates the actin cytoskeleton in PHT cells.

Enriched G-actin, F-actin and total actin fractions were isolated from Rictor and scramble siRNA silenced PHT cells. These fractions were resolved on SDS- PAGE gels and levels of F-actin, G-actin and total actin were analyzed by immunoblotting with anti-actin antibody. Densitometric analyses for actin levels were normalized to total lane proteins. Representative Western blots are shown for of F-actin (a), G-actin (c) and total actin (e) in actin enriched cell lysates of scramble siRNA, rictor siRNA PHT cells. Individual data point graphs (b, d, f, g) summarize the results. Values are given as means ± SEM.; n=4/each group, * P < 0.05 versus control; unpaired Student’s t test.
