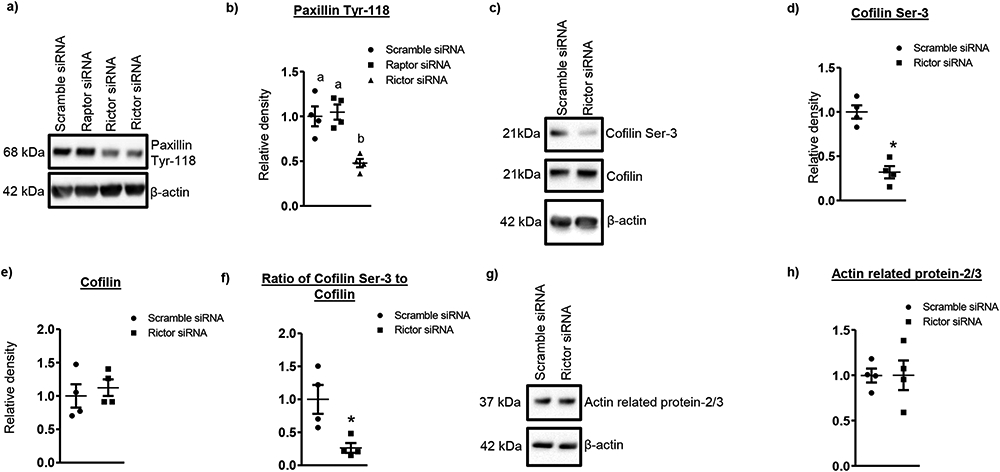
Figure 5. Decreased phosphorylation of paxillin and cofilin in Rictor silenced PHT cells.

(a, c) Representative western blot of phosphorylated paxillin, and total and phosphorylated cofilin expression in cell lysates of scramble siRNA and rictor silenced cells. Equal loading was performed. (b, d, e, f) Summary of the western blot data. (g) Representative western blot of actin related protein 2/3 in cell lysates of scramble siRNA and Rictor silenced cells. Equal loading was performed. (h) Summary of the western blot data. Values are given as means ± SEM.; n=4/each group, * P < 0.05 versus control; unpaired Student’s t test.
